Israeli vs Colville College, 1 year or more
COMPARE
Israeli
Colville
College, 1 year or more
College, 1 year or more Comparison
Israelis
Colville
65.3%
COLLEGE, 1 YEAR OR MORE
99.9/ 100
METRIC RATING
34th/ 347
METRIC RANK
54.1%
COLLEGE, 1 YEAR OR MORE
0.1/ 100
METRIC RATING
281st/ 347
METRIC RANK
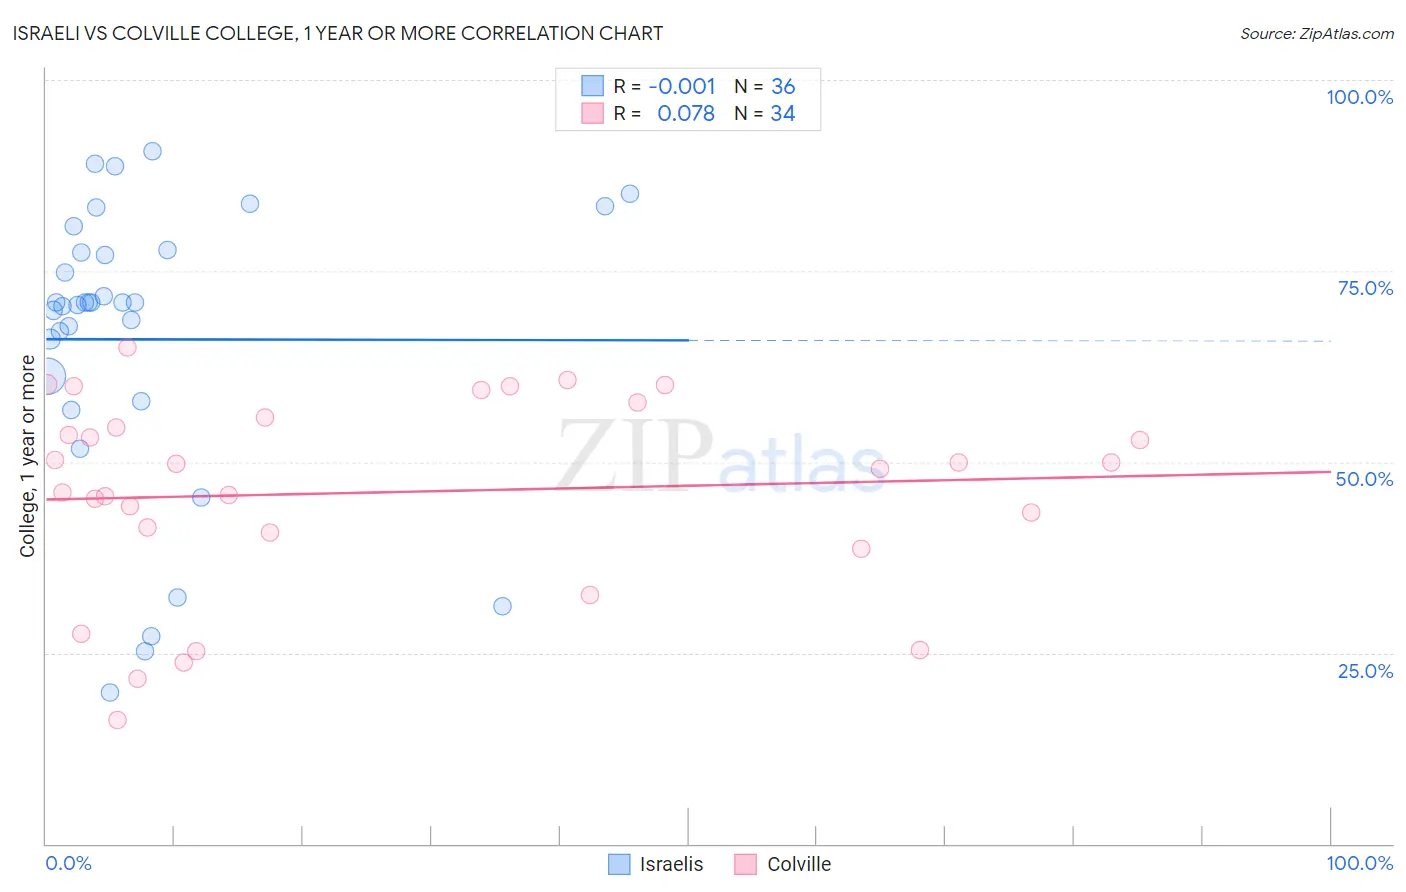
Israeli vs Colville College, 1 year or more Correlation Chart
The statistical analysis conducted on geographies consisting of 211,218,479 people shows no correlation between the proportion of Israelis and percentage of population with at least college, 1 year or more education in the United States with a correlation coefficient (R) of -0.001 and weighted average of 65.3%. Similarly, the statistical analysis conducted on geographies consisting of 34,687,707 people shows a slight positive correlation between the proportion of Colville and percentage of population with at least college, 1 year or more education in the United States with a correlation coefficient (R) of 0.078 and weighted average of 54.1%, a difference of 20.7%.
College, 1 year or more Correlation Summary
| Measurement | Israeli | Colville |
| Minimum | 19.8% | 16.3% |
| Maximum | 90.6% | 64.9% |
| Range | 70.9% | 48.6% |
| Mean | 66.0% | 46.0% |
| Median | 70.8% | 49.4% |
| Interquartile 25% (IQ1) | 59.5% | 40.7% |
| Interquartile 75% (IQ3) | 77.6% | 55.8% |
| Interquartile Range (IQR) | 18.0% | 15.1% |
| Standard Deviation (Sample) | 18.8% | 13.0% |
| Standard Deviation (Population) | 18.5% | 12.8% |
Similar Demographics by College, 1 year or more
Demographics Similar to Israelis by College, 1 year or more
In terms of college, 1 year or more, the demographic groups most similar to Israelis are Immigrants from Sri Lanka (65.4%, a difference of 0.12%), Immigrants from Turkey (65.2%, a difference of 0.20%), Bulgarian (65.5%, a difference of 0.27%), Immigrants from South Africa (65.1%, a difference of 0.28%), and Russian (65.1%, a difference of 0.28%).
| Demographics | Rating | Rank | College, 1 year or more |
| Immigrants | Ireland | 100.0 /100 | #27 | Exceptional 65.9% |
| Immigrants | France | 100.0 /100 | #28 | Exceptional 65.8% |
| Immigrants | Northern Europe | 100.0 /100 | #29 | Exceptional 65.6% |
| Immigrants | Denmark | 100.0 /100 | #30 | Exceptional 65.6% |
| Turks | 100.0 /100 | #31 | Exceptional 65.5% |
| Bulgarians | 100.0 /100 | #32 | Exceptional 65.5% |
| Immigrants | Sri Lanka | 99.9 /100 | #33 | Exceptional 65.4% |
| Israelis | 99.9 /100 | #34 | Exceptional 65.3% |
| Immigrants | Turkey | 99.9 /100 | #35 | Exceptional 65.2% |
| Immigrants | South Africa | 99.9 /100 | #36 | Exceptional 65.1% |
| Russians | 99.9 /100 | #37 | Exceptional 65.1% |
| Immigrants | Saudi Arabia | 99.9 /100 | #38 | Exceptional 65.0% |
| Estonians | 99.9 /100 | #39 | Exceptional 65.0% |
| Immigrants | Kuwait | 99.9 /100 | #40 | Exceptional 65.0% |
| Mongolians | 99.9 /100 | #41 | Exceptional 64.8% |
Demographics Similar to Colville by College, 1 year or more
In terms of college, 1 year or more, the demographic groups most similar to Colville are Cheyenne (54.1%, a difference of 0.010%), Guyanese (54.1%, a difference of 0.040%), Arapaho (54.1%, a difference of 0.070%), Immigrants from Jamaica (54.2%, a difference of 0.090%), and Nicaraguan (53.9%, a difference of 0.40%).
| Demographics | Rating | Rank | College, 1 year or more |
| Belizeans | 0.2 /100 | #274 | Tragic 54.4% |
| Americans | 0.2 /100 | #275 | Tragic 54.4% |
| Shoshone | 0.2 /100 | #276 | Tragic 54.3% |
| Ecuadorians | 0.2 /100 | #277 | Tragic 54.3% |
| Immigrants | Jamaica | 0.1 /100 | #278 | Tragic 54.2% |
| Arapaho | 0.1 /100 | #279 | Tragic 54.1% |
| Cheyenne | 0.1 /100 | #280 | Tragic 54.1% |
| Colville | 0.1 /100 | #281 | Tragic 54.1% |
| Guyanese | 0.1 /100 | #282 | Tragic 54.1% |
| Nicaraguans | 0.1 /100 | #283 | Tragic 53.9% |
| Ute | 0.1 /100 | #284 | Tragic 53.8% |
| Immigrants | Guyana | 0.1 /100 | #285 | Tragic 53.5% |
| Central American Indians | 0.1 /100 | #286 | Tragic 53.5% |
| Immigrants | Belize | 0.1 /100 | #287 | Tragic 53.5% |
| Alaska Natives | 0.0 /100 | #288 | Tragic 53.4% |