Dominican vs Zimbabwean College, 1 year or more
COMPARE
Dominican
Zimbabwean
College, 1 year or more
College, 1 year or more Comparison
Dominicans
Zimbabweans
50.6%
COLLEGE, 1 YEAR OR MORE
0.0/ 100
METRIC RATING
326th/ 347
METRIC RANK
64.2%
COLLEGE, 1 YEAR OR MORE
99.8/ 100
METRIC RATING
54th/ 347
METRIC RANK
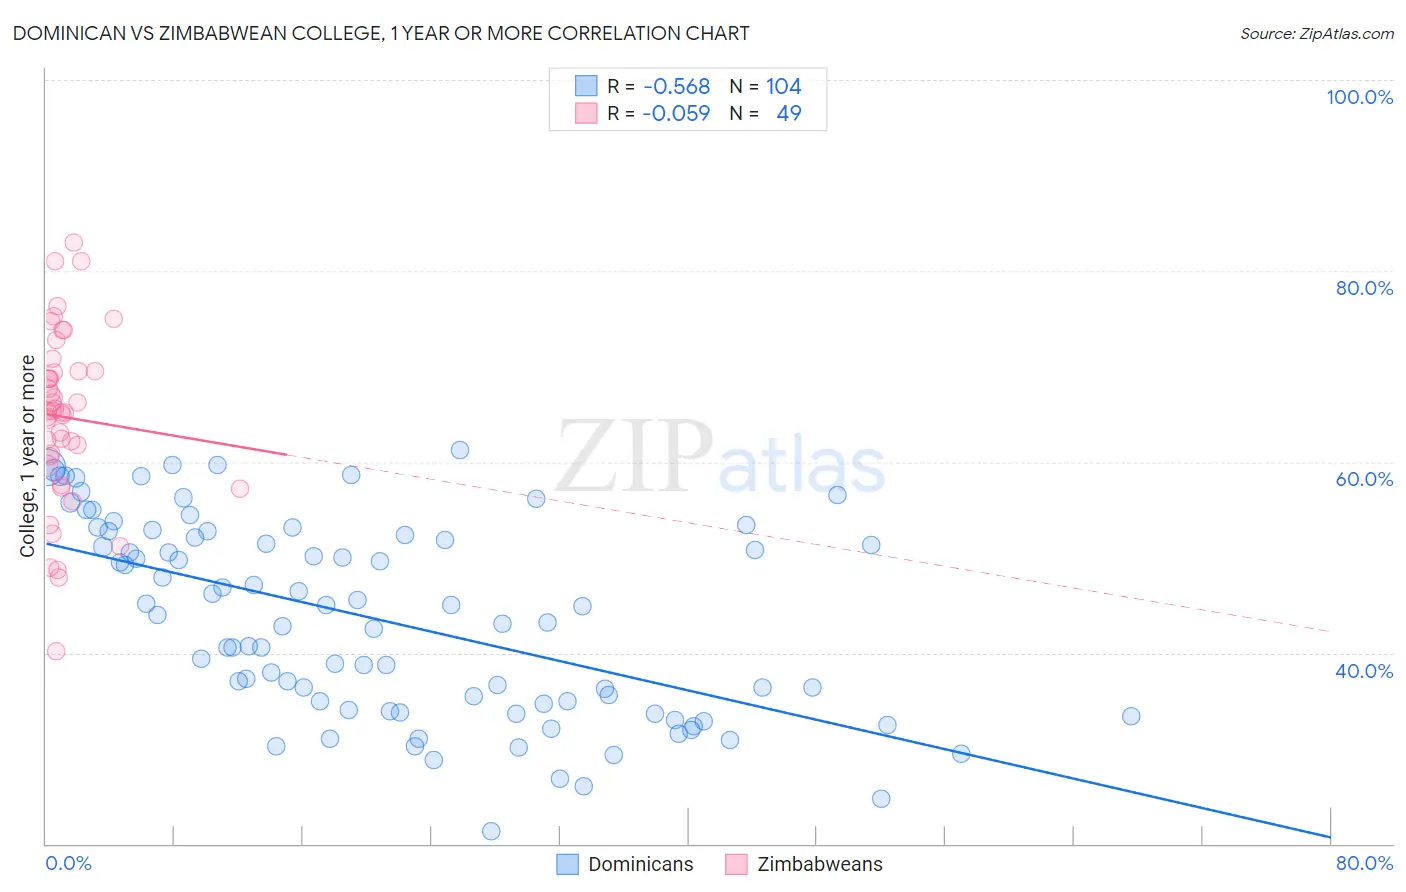
Dominican vs Zimbabwean College, 1 year or more Correlation Chart
The statistical analysis conducted on geographies consisting of 355,140,033 people shows a substantial negative correlation between the proportion of Dominicans and percentage of population with at least college, 1 year or more education in the United States with a correlation coefficient (R) of -0.568 and weighted average of 50.6%. Similarly, the statistical analysis conducted on geographies consisting of 69,202,005 people shows a slight negative correlation between the proportion of Zimbabweans and percentage of population with at least college, 1 year or more education in the United States with a correlation coefficient (R) of -0.059 and weighted average of 64.2%, a difference of 26.9%.
College, 1 year or more Correlation Summary
| Measurement | Dominican | Zimbabwean |
| Minimum | 21.3% | 40.2% |
| Maximum | 61.3% | 83.0% |
| Range | 40.0% | 42.8% |
| Mean | 43.4% | 64.7% |
| Median | 43.6% | 65.2% |
| Interquartile 25% (IQ1) | 34.3% | 60.1% |
| Interquartile 75% (IQ3) | 52.2% | 69.5% |
| Interquartile Range (IQR) | 17.8% | 9.4% |
| Standard Deviation (Sample) | 10.1% | 9.0% |
| Standard Deviation (Population) | 10.1% | 8.9% |
Similar Demographics by College, 1 year or more
Demographics Similar to Dominicans by College, 1 year or more
In terms of college, 1 year or more, the demographic groups most similar to Dominicans are Menominee (50.6%, a difference of 0.040%), Dutch West Indian (50.5%, a difference of 0.15%), Immigrants from Latin America (50.7%, a difference of 0.18%), Immigrants from Cuba (50.7%, a difference of 0.21%), and Immigrants from Guatemala (50.7%, a difference of 0.22%).
| Demographics | Rating | Rank | College, 1 year or more |
| Immigrants | El Salvador | 0.0 /100 | #319 | Tragic 51.0% |
| Kiowa | 0.0 /100 | #320 | Tragic 51.0% |
| Hopi | 0.0 /100 | #321 | Tragic 50.9% |
| Navajo | 0.0 /100 | #322 | Tragic 50.8% |
| Immigrants | Guatemala | 0.0 /100 | #323 | Tragic 50.7% |
| Immigrants | Cuba | 0.0 /100 | #324 | Tragic 50.7% |
| Immigrants | Latin America | 0.0 /100 | #325 | Tragic 50.7% |
| Dominicans | 0.0 /100 | #326 | Tragic 50.6% |
| Menominee | 0.0 /100 | #327 | Tragic 50.6% |
| Dutch West Indians | 0.0 /100 | #328 | Tragic 50.5% |
| Cape Verdeans | 0.0 /100 | #329 | Tragic 50.3% |
| Natives/Alaskans | 0.0 /100 | #330 | Tragic 50.2% |
| Immigrants | Yemen | 0.0 /100 | #331 | Tragic 50.0% |
| Mexicans | 0.0 /100 | #332 | Tragic 49.2% |
| Immigrants | Dominican Republic | 0.0 /100 | #333 | Tragic 49.1% |
Demographics Similar to Zimbabweans by College, 1 year or more
In terms of college, 1 year or more, the demographic groups most similar to Zimbabweans are Asian (64.2%, a difference of 0.030%), Immigrants from Netherlands (64.2%, a difference of 0.050%), Immigrants from Belarus (64.1%, a difference of 0.12%), Immigrants from Czechoslovakia (64.1%, a difference of 0.15%), and South African (64.1%, a difference of 0.16%).
| Demographics | Rating | Rank | College, 1 year or more |
| Australians | 99.9 /100 | #47 | Exceptional 64.6% |
| Immigrants | Bulgaria | 99.9 /100 | #48 | Exceptional 64.6% |
| New Zealanders | 99.9 /100 | #49 | Exceptional 64.6% |
| Immigrants | Austria | 99.8 /100 | #50 | Exceptional 64.4% |
| Immigrants | Malaysia | 99.8 /100 | #51 | Exceptional 64.3% |
| Immigrants | Netherlands | 99.8 /100 | #52 | Exceptional 64.2% |
| Asians | 99.8 /100 | #53 | Exceptional 64.2% |
| Zimbabweans | 99.8 /100 | #54 | Exceptional 64.2% |
| Immigrants | Belarus | 99.7 /100 | #55 | Exceptional 64.1% |
| Immigrants | Czechoslovakia | 99.7 /100 | #56 | Exceptional 64.1% |
| South Africans | 99.7 /100 | #57 | Exceptional 64.1% |
| Immigrants | Asia | 99.7 /100 | #58 | Exceptional 64.0% |
| Immigrants | Serbia | 99.6 /100 | #59 | Exceptional 63.8% |
| Immigrants | Kazakhstan | 99.5 /100 | #60 | Exceptional 63.6% |
| Bolivians | 99.5 /100 | #61 | Exceptional 63.5% |