Israeli vs Zimbabwean Unemployment Among Ages 60 to 64 years
COMPARE
Israeli
Zimbabwean
Unemployment Among Ages 60 to 64 years
Unemployment Among Ages 60 to 64 years Comparison
Israelis
Zimbabweans
5.2%
UNEMPLOYMENT AMONG AGES 60 TO 64 YEARS
0.1/ 100
METRIC RATING
271st/ 347
METRIC RANK
4.5%
UNEMPLOYMENT AMONG AGES 60 TO 64 YEARS
100.0/ 100
METRIC RATING
32nd/ 347
METRIC RANK
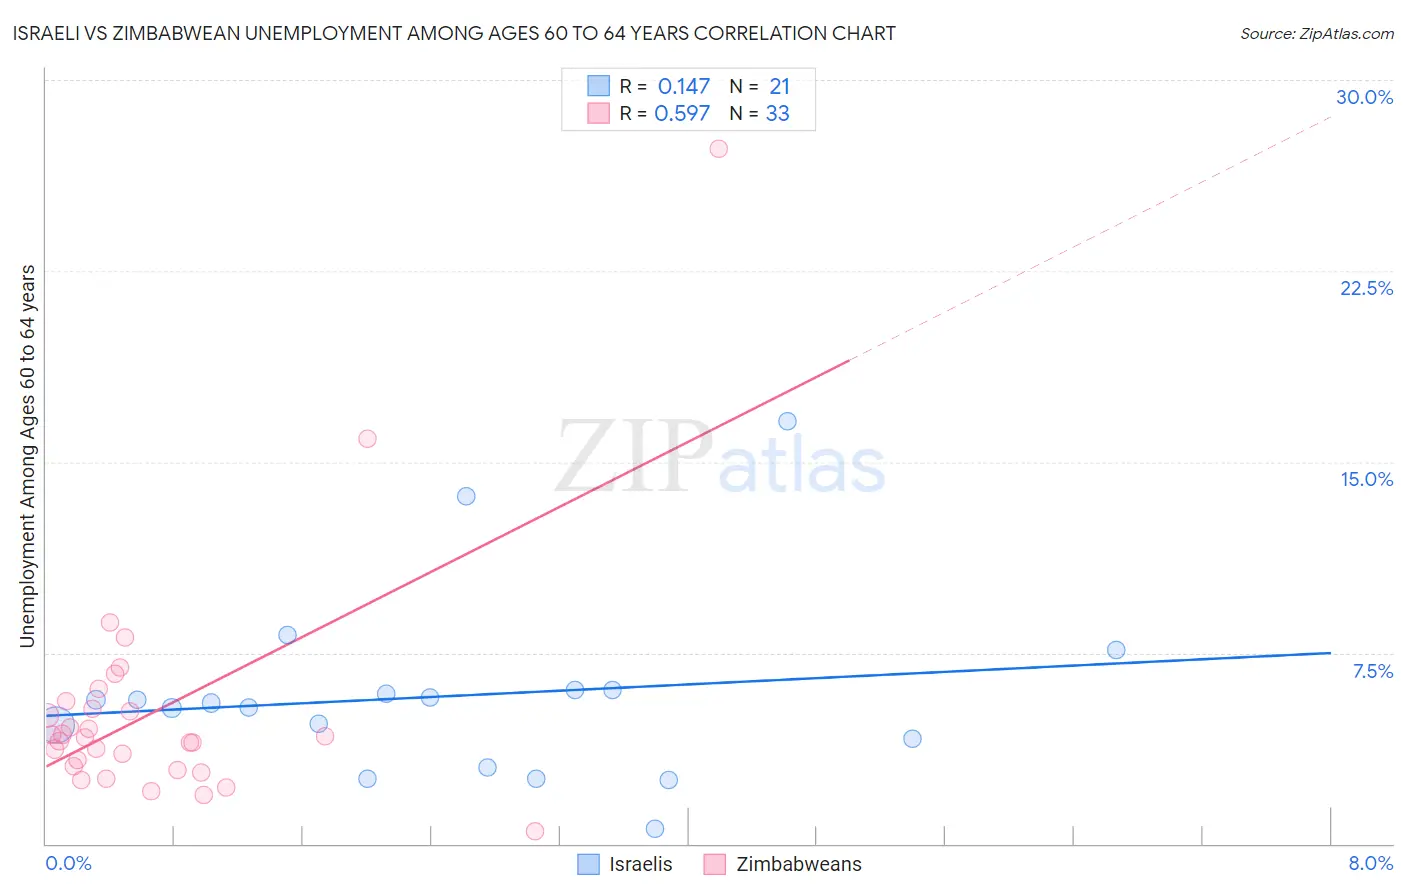
Israeli vs Zimbabwean Unemployment Among Ages 60 to 64 years Correlation Chart
The statistical analysis conducted on geographies consisting of 200,300,436 people shows a poor positive correlation between the proportion of Israelis and unemployment rate among population between the ages 60 and 64 in the United States with a correlation coefficient (R) of 0.147 and weighted average of 5.2%. Similarly, the statistical analysis conducted on geographies consisting of 67,535,579 people shows a substantial positive correlation between the proportion of Zimbabweans and unemployment rate among population between the ages 60 and 64 in the United States with a correlation coefficient (R) of 0.597 and weighted average of 4.5%, a difference of 15.4%.
Unemployment Among Ages 60 to 64 years Correlation Summary
| Measurement | Israeli | Zimbabwean |
| Minimum | 0.60% | 0.50% |
| Maximum | 16.6% | 27.3% |
| Range | 16.0% | 26.8% |
| Mean | 5.8% | 5.3% |
| Median | 5.5% | 4.2% |
| Interquartile 25% (IQ1) | 3.6% | 3.0% |
| Interquartile 75% (IQ3) | 6.0% | 5.5% |
| Interquartile Range (IQR) | 2.5% | 2.5% |
| Standard Deviation (Sample) | 3.6% | 4.8% |
| Standard Deviation (Population) | 3.5% | 4.7% |
Similar Demographics by Unemployment Among Ages 60 to 64 years
Demographics Similar to Israelis by Unemployment Among Ages 60 to 64 years
In terms of unemployment among ages 60 to 64 years, the demographic groups most similar to Israelis are Haitian (5.2%, a difference of 0.030%), Immigrants from Spain (5.2%, a difference of 0.10%), Hopi (5.2%, a difference of 0.24%), Immigrants from Iran (5.1%, a difference of 0.27%), and Immigrants from Hong Kong (5.2%, a difference of 0.38%).
| Demographics | Rating | Rank | Unemployment Among Ages 60 to 64 years |
| Sioux | 0.3 /100 | #264 | Tragic 5.1% |
| Immigrants | Argentina | 0.2 /100 | #265 | Tragic 5.1% |
| Immigrants | Australia | 0.2 /100 | #266 | Tragic 5.1% |
| Immigrants | Bahamas | 0.2 /100 | #267 | Tragic 5.1% |
| Central American Indians | 0.2 /100 | #268 | Tragic 5.1% |
| Immigrants | Costa Rica | 0.2 /100 | #269 | Tragic 5.1% |
| Immigrants | Iran | 0.1 /100 | #270 | Tragic 5.1% |
| Israelis | 0.1 /100 | #271 | Tragic 5.2% |
| Haitians | 0.1 /100 | #272 | Tragic 5.2% |
| Immigrants | Spain | 0.1 /100 | #273 | Tragic 5.2% |
| Hopi | 0.1 /100 | #274 | Tragic 5.2% |
| Immigrants | Hong Kong | 0.1 /100 | #275 | Tragic 5.2% |
| Central Americans | 0.0 /100 | #276 | Tragic 5.2% |
| Immigrants | Caribbean | 0.0 /100 | #277 | Tragic 5.2% |
| Guatemalans | 0.0 /100 | #278 | Tragic 5.2% |
Demographics Similar to Zimbabweans by Unemployment Among Ages 60 to 64 years
In terms of unemployment among ages 60 to 64 years, the demographic groups most similar to Zimbabweans are Immigrants from Eritrea (4.5%, a difference of 0.040%), Carpatho Rusyn (4.5%, a difference of 0.050%), Immigrants from Venezuela (4.5%, a difference of 0.11%), Cuban (4.5%, a difference of 0.13%), and Belgian (4.5%, a difference of 0.31%).
| Demographics | Rating | Rank | Unemployment Among Ages 60 to 64 years |
| Yugoslavians | 100.0 /100 | #25 | Exceptional 4.4% |
| Czechs | 100.0 /100 | #26 | Exceptional 4.4% |
| Immigrants | Iraq | 100.0 /100 | #27 | Exceptional 4.5% |
| Immigrants | Nepal | 100.0 /100 | #28 | Exceptional 4.5% |
| Cubans | 100.0 /100 | #29 | Exceptional 4.5% |
| Immigrants | Venezuela | 100.0 /100 | #30 | Exceptional 4.5% |
| Immigrants | Eritrea | 100.0 /100 | #31 | Exceptional 4.5% |
| Zimbabweans | 100.0 /100 | #32 | Exceptional 4.5% |
| Carpatho Rusyns | 100.0 /100 | #33 | Exceptional 4.5% |
| Belgians | 100.0 /100 | #34 | Exceptional 4.5% |
| Germans | 100.0 /100 | #35 | Exceptional 4.5% |
| Venezuelans | 100.0 /100 | #36 | Exceptional 4.5% |
| Immigrants | Portugal | 100.0 /100 | #37 | Exceptional 4.5% |
| Native Hawaiians | 100.0 /100 | #38 | Exceptional 4.5% |
| Iraqis | 100.0 /100 | #39 | Exceptional 4.5% |