Israeli vs Seminole High School Diploma
COMPARE
Israeli
Seminole
High School Diploma
High School Diploma Comparison
Israelis
Seminole
90.1%
HIGH SCHOOL DIPLOMA
95.1/ 100
METRIC RATING
118th/ 347
METRIC RANK
87.3%
HIGH SCHOOL DIPLOMA
0.4/ 100
METRIC RATING
261st/ 347
METRIC RANK
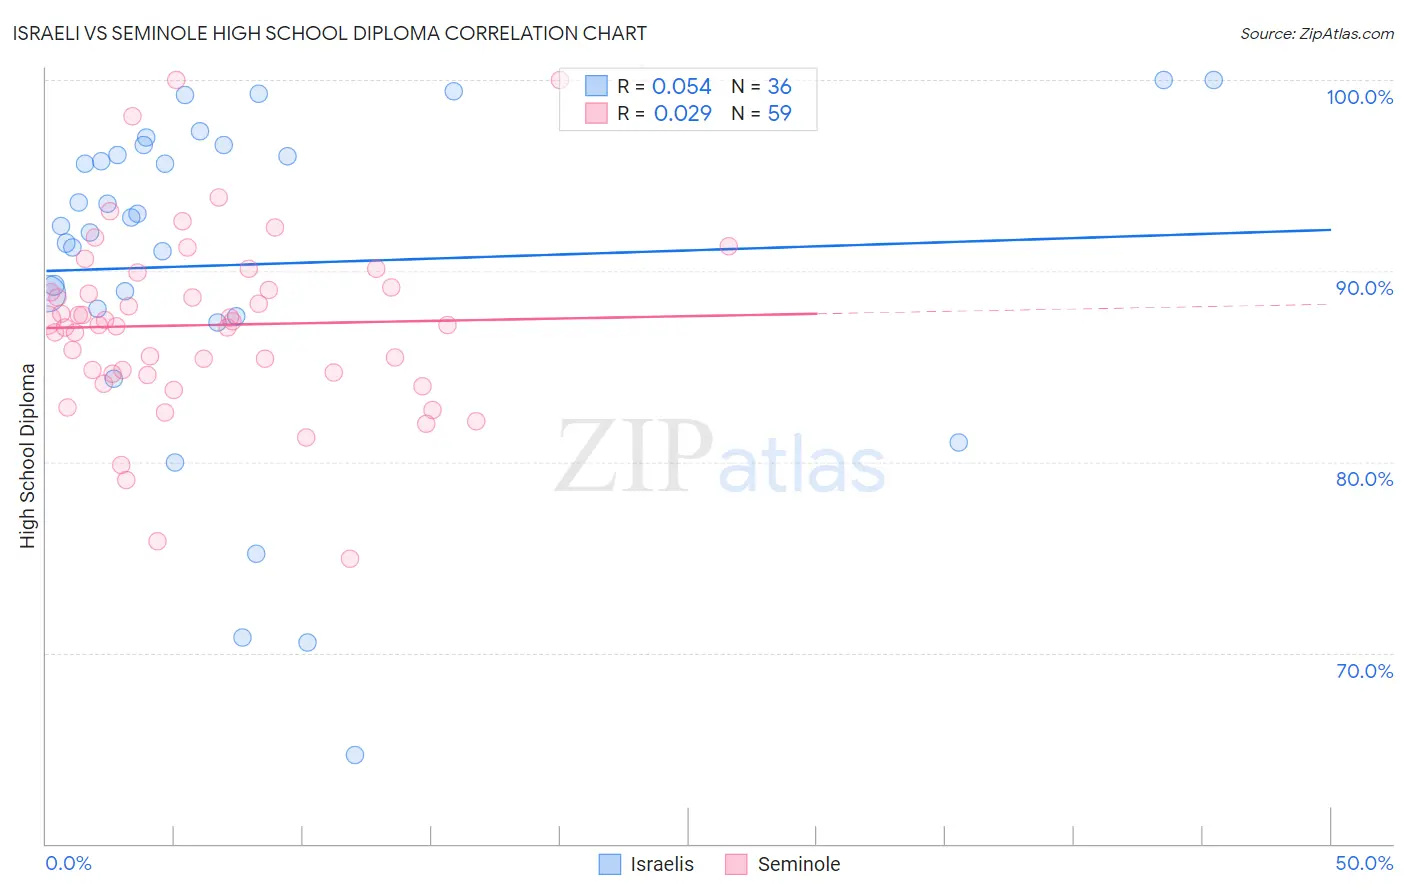
Israeli vs Seminole High School Diploma Correlation Chart
The statistical analysis conducted on geographies consisting of 211,220,500 people shows a slight positive correlation between the proportion of Israelis and percentage of population with at least high school diploma education in the United States with a correlation coefficient (R) of 0.054 and weighted average of 90.1%. Similarly, the statistical analysis conducted on geographies consisting of 118,313,988 people shows no correlation between the proportion of Seminole and percentage of population with at least high school diploma education in the United States with a correlation coefficient (R) of 0.029 and weighted average of 87.3%, a difference of 3.3%.
High School Diploma Correlation Summary
| Measurement | Israeli | Seminole |
| Minimum | 64.7% | 74.9% |
| Maximum | 100.0% | 100.0% |
| Range | 35.3% | 25.1% |
| Mean | 90.3% | 87.2% |
| Median | 92.6% | 87.2% |
| Interquartile 25% (IQ1) | 87.8% | 84.6% |
| Interquartile 75% (IQ3) | 96.3% | 89.1% |
| Interquartile Range (IQR) | 8.5% | 4.5% |
| Standard Deviation (Sample) | 8.8% | 4.8% |
| Standard Deviation (Population) | 8.7% | 4.7% |
Similar Demographics by High School Diploma
Demographics Similar to Israelis by High School Diploma
In terms of high school diploma, the demographic groups most similar to Israelis are Jordanian (90.2%, a difference of 0.020%), Immigrants from Eastern Europe (90.1%, a difference of 0.020%), Immigrants from Germany (90.2%, a difference of 0.050%), Ottawa (90.1%, a difference of 0.050%), and Immigrants from Hungary (90.2%, a difference of 0.060%).
| Demographics | Rating | Rank | High School Diploma |
| Menominee | 96.6 /100 | #111 | Exceptional 90.3% |
| Immigrants | Belarus | 96.4 /100 | #112 | Exceptional 90.2% |
| Immigrants | Sri Lanka | 96.3 /100 | #113 | Exceptional 90.2% |
| Yugoslavians | 96.2 /100 | #114 | Exceptional 90.2% |
| Immigrants | Hungary | 95.8 /100 | #115 | Exceptional 90.2% |
| Immigrants | Germany | 95.7 /100 | #116 | Exceptional 90.2% |
| Jordanians | 95.4 /100 | #117 | Exceptional 90.2% |
| Israelis | 95.1 /100 | #118 | Exceptional 90.1% |
| Immigrants | Eastern Europe | 94.9 /100 | #119 | Exceptional 90.1% |
| Ottawa | 94.4 /100 | #120 | Exceptional 90.1% |
| Whites/Caucasians | 94.1 /100 | #121 | Exceptional 90.1% |
| Immigrants | Kazakhstan | 93.4 /100 | #122 | Exceptional 90.0% |
| German Russians | 92.0 /100 | #123 | Exceptional 90.0% |
| Mongolians | 91.6 /100 | #124 | Exceptional 89.9% |
| Egyptians | 91.1 /100 | #125 | Exceptional 89.9% |
Demographics Similar to Seminole by High School Diploma
In terms of high school diploma, the demographic groups most similar to Seminole are Cajun (87.3%, a difference of 0.020%), Immigrants from Peru (87.3%, a difference of 0.030%), Immigrants from South Eastern Asia (87.2%, a difference of 0.060%), Jamaican (87.2%, a difference of 0.080%), and Immigrants from Ghana (87.4%, a difference of 0.10%).
| Demographics | Rating | Rank | High School Diploma |
| Immigrants | Colombia | 1.0 /100 | #254 | Tragic 87.6% |
| Immigrants | Senegal | 0.9 /100 | #255 | Tragic 87.6% |
| Africans | 0.7 /100 | #256 | Tragic 87.5% |
| Bahamians | 0.7 /100 | #257 | Tragic 87.5% |
| Immigrants | Ghana | 0.5 /100 | #258 | Tragic 87.4% |
| Immigrants | Western Africa | 0.5 /100 | #259 | Tragic 87.4% |
| Cajuns | 0.4 /100 | #260 | Tragic 87.3% |
| Seminole | 0.4 /100 | #261 | Tragic 87.3% |
| Immigrants | Peru | 0.4 /100 | #262 | Tragic 87.3% |
| Immigrants | South Eastern Asia | 0.3 /100 | #263 | Tragic 87.2% |
| Jamaicans | 0.3 /100 | #264 | Tragic 87.2% |
| U.S. Virgin Islanders | 0.2 /100 | #265 | Tragic 87.1% |
| Immigrants | Congo | 0.2 /100 | #266 | Tragic 87.0% |
| Blacks/African Americans | 0.2 /100 | #267 | Tragic 87.0% |
| Pennsylvania Germans | 0.2 /100 | #268 | Tragic 87.0% |