Iroquois vs Austrian College, 1 year or more
COMPARE
Iroquois
Austrian
College, 1 year or more
College, 1 year or more Comparison
Iroquois
Austrians
56.2%
COLLEGE, 1 YEAR OR MORE
1.7/ 100
METRIC RATING
236th/ 347
METRIC RANK
61.8%
COLLEGE, 1 YEAR OR MORE
95.4/ 100
METRIC RATING
112th/ 347
METRIC RANK
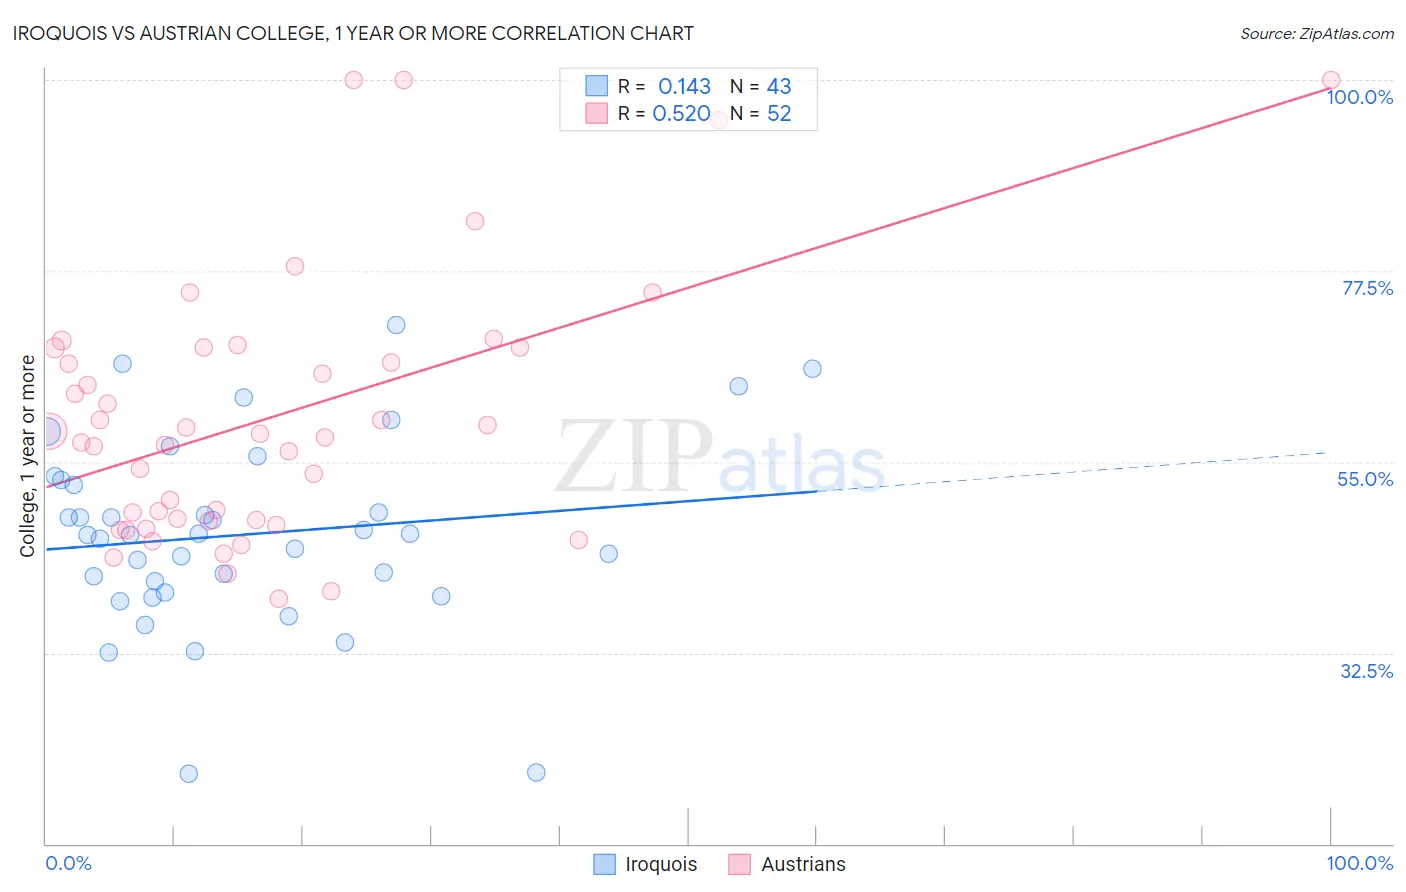
Iroquois vs Austrian College, 1 year or more Correlation Chart
The statistical analysis conducted on geographies consisting of 207,308,587 people shows a poor positive correlation between the proportion of Iroquois and percentage of population with at least college, 1 year or more education in the United States with a correlation coefficient (R) of 0.143 and weighted average of 56.2%. Similarly, the statistical analysis conducted on geographies consisting of 452,079,126 people shows a substantial positive correlation between the proportion of Austrians and percentage of population with at least college, 1 year or more education in the United States with a correlation coefficient (R) of 0.520 and weighted average of 61.8%, a difference of 9.9%.
College, 1 year or more Correlation Summary
| Measurement | Iroquois | Austrian |
| Minimum | 18.2% | 38.8% |
| Maximum | 71.2% | 100.0% |
| Range | 53.0% | 61.2% |
| Mean | 46.4% | 60.2% |
| Median | 46.3% | 58.1% |
| Interquartile 25% (IQ1) | 39.6% | 48.1% |
| Interquartile 75% (IQ3) | 52.8% | 68.4% |
| Interquartile Range (IQR) | 13.3% | 20.3% |
| Standard Deviation (Sample) | 11.2% | 15.3% |
| Standard Deviation (Population) | 11.1% | 15.2% |
Similar Demographics by College, 1 year or more
Demographics Similar to Iroquois by College, 1 year or more
In terms of college, 1 year or more, the demographic groups most similar to Iroquois are Spanish American (56.3%, a difference of 0.050%), West Indian (56.3%, a difference of 0.050%), Samoan (56.2%, a difference of 0.11%), Barbadian (56.0%, a difference of 0.38%), and Nonimmigrants (56.5%, a difference of 0.50%).
| Demographics | Rating | Rank | College, 1 year or more |
| Cree | 3.6 /100 | #229 | Tragic 56.8% |
| Liberians | 3.1 /100 | #230 | Tragic 56.7% |
| Immigrants | Burma/Myanmar | 2.7 /100 | #231 | Tragic 56.6% |
| Immigrants | Bangladesh | 2.6 /100 | #232 | Tragic 56.6% |
| Immigrants | Nonimmigrants | 2.5 /100 | #233 | Tragic 56.5% |
| Spanish Americans | 1.8 /100 | #234 | Tragic 56.3% |
| West Indians | 1.8 /100 | #235 | Tragic 56.3% |
| Iroquois | 1.7 /100 | #236 | Tragic 56.2% |
| Samoans | 1.6 /100 | #237 | Tragic 56.2% |
| Barbadians | 1.3 /100 | #238 | Tragic 56.0% |
| Puget Sound Salish | 1.1 /100 | #239 | Tragic 55.9% |
| Trinidadians and Tobagonians | 1.1 /100 | #240 | Tragic 55.8% |
| French American Indians | 1.0 /100 | #241 | Tragic 55.8% |
| Marshallese | 1.0 /100 | #242 | Tragic 55.8% |
| Osage | 1.0 /100 | #243 | Tragic 55.8% |
Demographics Similar to Austrians by College, 1 year or more
In terms of college, 1 year or more, the demographic groups most similar to Austrians are European (61.8%, a difference of 0.060%), Macedonian (61.8%, a difference of 0.060%), Ukrainian (61.8%, a difference of 0.070%), Syrian (61.9%, a difference of 0.080%), and Immigrants from Northern Africa (61.9%, a difference of 0.080%).
| Demographics | Rating | Rank | College, 1 year or more |
| Immigrants | Nepal | 96.3 /100 | #105 | Exceptional 62.0% |
| Palestinians | 96.3 /100 | #106 | Exceptional 62.0% |
| Immigrants | Ukraine | 95.8 /100 | #107 | Exceptional 61.9% |
| Syrians | 95.7 /100 | #108 | Exceptional 61.9% |
| Immigrants | Northern Africa | 95.7 /100 | #109 | Exceptional 61.9% |
| Europeans | 95.6 /100 | #110 | Exceptional 61.8% |
| Macedonians | 95.6 /100 | #111 | Exceptional 61.8% |
| Austrians | 95.4 /100 | #112 | Exceptional 61.8% |
| Ukrainians | 95.2 /100 | #113 | Exceptional 61.8% |
| Danes | 94.8 /100 | #114 | Exceptional 61.7% |
| Norwegians | 94.5 /100 | #115 | Exceptional 61.7% |
| Lebanese | 94.1 /100 | #116 | Exceptional 61.6% |
| Arabs | 93.9 /100 | #117 | Exceptional 61.6% |
| Immigrants | Brazil | 93.9 /100 | #118 | Exceptional 61.6% |
| Assyrians/Chaldeans/Syriacs | 93.3 /100 | #119 | Exceptional 61.5% |