Irish vs Immigrants from Belarus 9th Grade
COMPARE
Irish
Immigrants from Belarus
9th Grade
9th Grade Comparison
Irish
Immigrants from Belarus
96.5%
9TH GRADE
100.0/ 100
METRIC RATING
15th/ 347
METRIC RANK
95.2%
9TH GRADE
88.9/ 100
METRIC RATING
135th/ 347
METRIC RANK
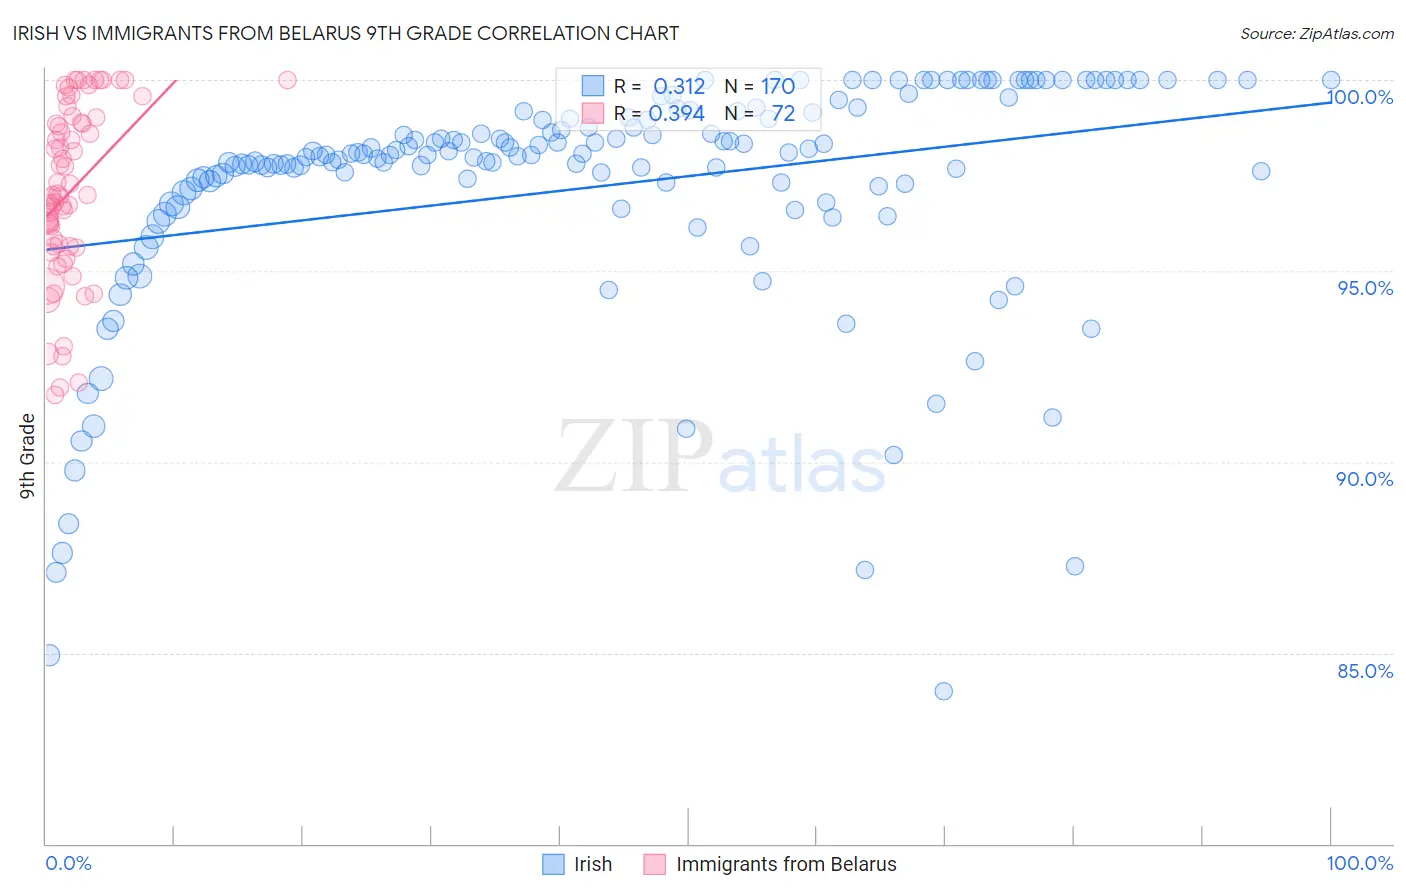
Irish vs Immigrants from Belarus 9th Grade Correlation Chart
The statistical analysis conducted on geographies consisting of 580,710,287 people shows a mild positive correlation between the proportion of Irish and percentage of population with at least 9th grade education in the United States with a correlation coefficient (R) of 0.312 and weighted average of 96.5%. Similarly, the statistical analysis conducted on geographies consisting of 149,993,317 people shows a mild positive correlation between the proportion of Immigrants from Belarus and percentage of population with at least 9th grade education in the United States with a correlation coefficient (R) of 0.394 and weighted average of 95.2%, a difference of 1.4%.
9th Grade Correlation Summary
| Measurement | Irish | Immigrants from Belarus |
| Minimum | 84.0% | 91.7% |
| Maximum | 100.0% | 100.0% |
| Range | 16.0% | 8.3% |
| Mean | 97.2% | 97.1% |
| Median | 98.0% | 97.0% |
| Interquartile 25% (IQ1) | 97.0% | 95.6% |
| Interquartile 75% (IQ3) | 99.0% | 99.0% |
| Interquartile Range (IQR) | 2.0% | 3.3% |
| Standard Deviation (Sample) | 3.1% | 2.2% |
| Standard Deviation (Population) | 3.1% | 2.2% |
Similar Demographics by 9th Grade
Demographics Similar to Irish by 9th Grade
In terms of 9th grade, the demographic groups most similar to Irish are Scottish (96.5%, a difference of 0.0%), Croatian (96.5%, a difference of 0.0%), Danish (96.5%, a difference of 0.010%), English (96.6%, a difference of 0.050%), and Dutch (96.5%, a difference of 0.060%).
| Demographics | Rating | Rank | 9th Grade |
| Germans | 100.0 /100 | #8 | Exceptional 96.7% |
| Tlingit-Haida | 100.0 /100 | #9 | Exceptional 96.6% |
| Lithuanians | 100.0 /100 | #10 | Exceptional 96.6% |
| Finns | 100.0 /100 | #11 | Exceptional 96.6% |
| English | 100.0 /100 | #12 | Exceptional 96.6% |
| Danes | 100.0 /100 | #13 | Exceptional 96.5% |
| Scottish | 100.0 /100 | #14 | Exceptional 96.5% |
| Irish | 100.0 /100 | #15 | Exceptional 96.5% |
| Croatians | 100.0 /100 | #16 | Exceptional 96.5% |
| Dutch | 100.0 /100 | #17 | Exceptional 96.5% |
| Scandinavians | 100.0 /100 | #18 | Exceptional 96.5% |
| Welsh | 100.0 /100 | #19 | Exceptional 96.4% |
| Italians | 100.0 /100 | #20 | Exceptional 96.4% |
| Alaskan Athabascans | 100.0 /100 | #21 | Exceptional 96.4% |
| Europeans | 100.0 /100 | #22 | Exceptional 96.4% |
Demographics Similar to Immigrants from Belarus by 9th Grade
In terms of 9th grade, the demographic groups most similar to Immigrants from Belarus are Immigrants from Israel (95.3%, a difference of 0.010%), Immigrants from Iran (95.2%, a difference of 0.010%), Hmong (95.2%, a difference of 0.020%), Israeli (95.3%, a difference of 0.030%), and Immigrants from Russia (95.2%, a difference of 0.040%).
| Demographics | Rating | Rank | 9th Grade |
| Immigrants | Hungary | 94.2 /100 | #128 | Exceptional 95.4% |
| Basques | 94.1 /100 | #129 | Exceptional 95.4% |
| Jordanians | 93.5 /100 | #130 | Exceptional 95.3% |
| Immigrants | North Macedonia | 92.3 /100 | #131 | Exceptional 95.3% |
| Immigrants | Nonimmigrants | 92.0 /100 | #132 | Exceptional 95.3% |
| Israelis | 90.4 /100 | #133 | Exceptional 95.3% |
| Immigrants | Israel | 89.6 /100 | #134 | Excellent 95.3% |
| Immigrants | Belarus | 88.9 /100 | #135 | Excellent 95.2% |
| Immigrants | Iran | 88.3 /100 | #136 | Excellent 95.2% |
| Hmong | 87.7 /100 | #137 | Excellent 95.2% |
| Immigrants | Russia | 86.6 /100 | #138 | Excellent 95.2% |
| Immigrants | Eastern Europe | 85.8 /100 | #139 | Excellent 95.2% |
| Immigrants | Taiwan | 85.3 /100 | #140 | Excellent 95.2% |
| Immigrants | Bosnia and Herzegovina | 85.2 /100 | #141 | Excellent 95.2% |
| Immigrants | Greece | 84.6 /100 | #142 | Excellent 95.2% |