Immigrants from Argentina vs Immigrants from Belarus 9th Grade
COMPARE
Immigrants from Argentina
Immigrants from Belarus
9th Grade
9th Grade Comparison
Immigrants from Argentina
Immigrants from Belarus
94.8%
9TH GRADE
34.4/ 100
METRIC RATING
189th/ 347
METRIC RANK
95.2%
9TH GRADE
88.9/ 100
METRIC RATING
135th/ 347
METRIC RANK
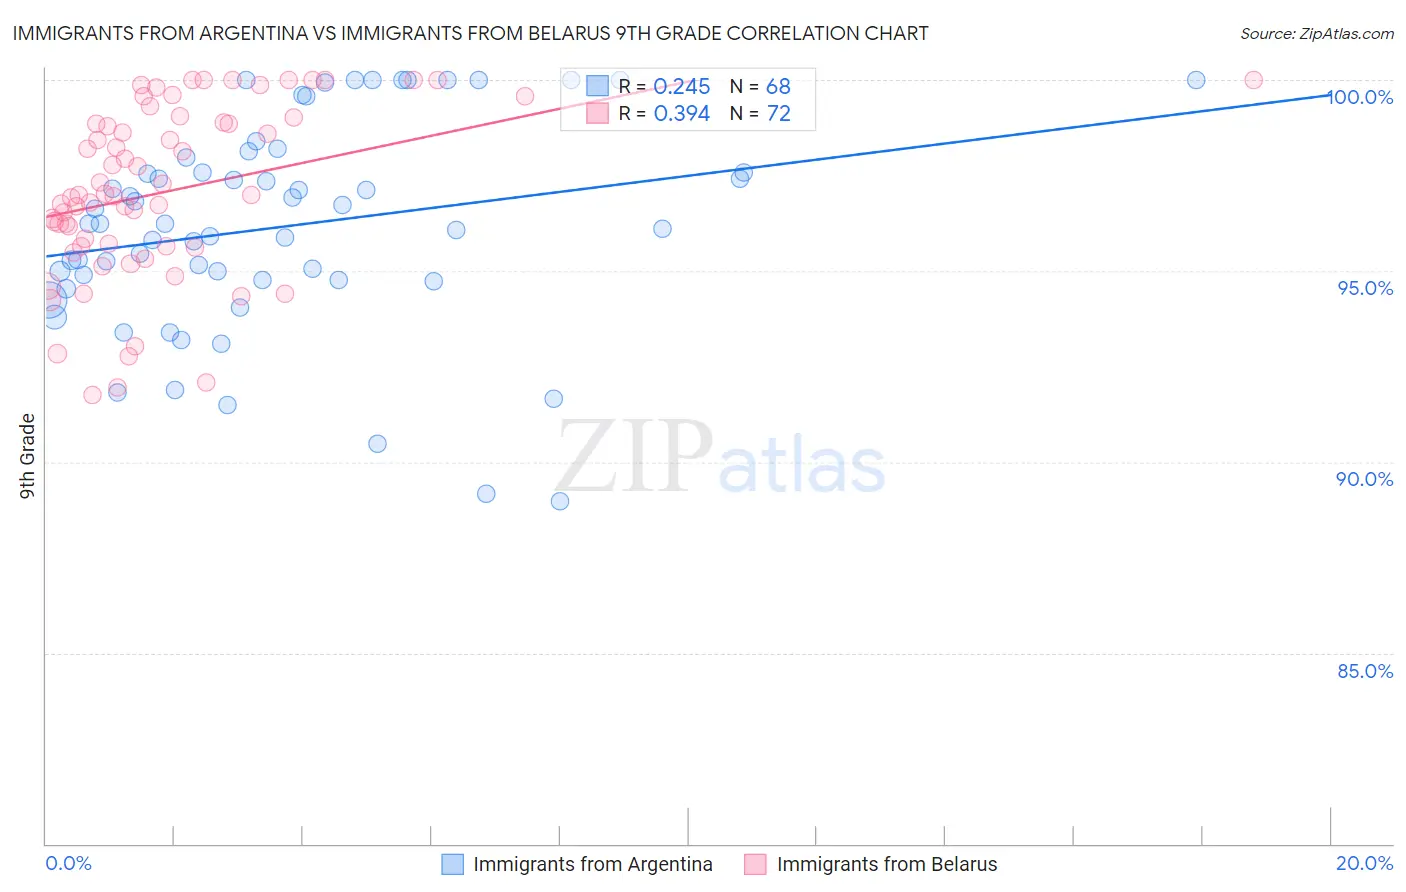
Immigrants from Argentina vs Immigrants from Belarus 9th Grade Correlation Chart
The statistical analysis conducted on geographies consisting of 264,436,618 people shows a weak positive correlation between the proportion of Immigrants from Argentina and percentage of population with at least 9th grade education in the United States with a correlation coefficient (R) of 0.245 and weighted average of 94.8%. Similarly, the statistical analysis conducted on geographies consisting of 149,993,317 people shows a mild positive correlation between the proportion of Immigrants from Belarus and percentage of population with at least 9th grade education in the United States with a correlation coefficient (R) of 0.394 and weighted average of 95.2%, a difference of 0.50%.
9th Grade Correlation Summary
| Measurement | Immigrants from Argentina | Immigrants from Belarus |
| Minimum | 89.0% | 91.7% |
| Maximum | 100.0% | 100.0% |
| Range | 11.0% | 8.3% |
| Mean | 96.2% | 97.1% |
| Median | 96.2% | 97.0% |
| Interquartile 25% (IQ1) | 94.8% | 95.6% |
| Interquartile 75% (IQ3) | 97.8% | 99.0% |
| Interquartile Range (IQR) | 3.0% | 3.3% |
| Standard Deviation (Sample) | 2.7% | 2.2% |
| Standard Deviation (Population) | 2.7% | 2.2% |
Similar Demographics by 9th Grade
Demographics Similar to Immigrants from Argentina by 9th Grade
In terms of 9th grade, the demographic groups most similar to Immigrants from Argentina are Immigrants from Albania (94.8%, a difference of 0.0%), Guamanian/Chamorro (94.8%, a difference of 0.010%), Sudanese (94.7%, a difference of 0.010%), Liberian (94.8%, a difference of 0.020%), and Hopi (94.8%, a difference of 0.020%).
| Demographics | Rating | Rank | 9th Grade |
| Seminole | 42.5 /100 | #182 | Average 94.8% |
| Immigrants | Nepal | 39.7 /100 | #183 | Fair 94.8% |
| Argentineans | 37.6 /100 | #184 | Fair 94.8% |
| Liberians | 37.4 /100 | #185 | Fair 94.8% |
| Hopi | 37.1 /100 | #186 | Fair 94.8% |
| Guamanians/Chamorros | 35.5 /100 | #187 | Fair 94.8% |
| Immigrants | Albania | 34.5 /100 | #188 | Fair 94.8% |
| Immigrants | Argentina | 34.4 /100 | #189 | Fair 94.8% |
| Sudanese | 32.7 /100 | #190 | Fair 94.7% |
| Assyrians/Chaldeans/Syriacs | 32.0 /100 | #191 | Fair 94.7% |
| Immigrants | Northern Africa | 30.7 /100 | #192 | Fair 94.7% |
| Paraguayans | 30.1 /100 | #193 | Fair 94.7% |
| Panamanians | 29.0 /100 | #194 | Fair 94.7% |
| Marshallese | 27.9 /100 | #195 | Fair 94.7% |
| Immigrants | Lebanon | 27.2 /100 | #196 | Fair 94.7% |
Demographics Similar to Immigrants from Belarus by 9th Grade
In terms of 9th grade, the demographic groups most similar to Immigrants from Belarus are Immigrants from Israel (95.3%, a difference of 0.010%), Immigrants from Iran (95.2%, a difference of 0.010%), Hmong (95.2%, a difference of 0.020%), Israeli (95.3%, a difference of 0.030%), and Immigrants from Russia (95.2%, a difference of 0.040%).
| Demographics | Rating | Rank | 9th Grade |
| Immigrants | Hungary | 94.2 /100 | #128 | Exceptional 95.4% |
| Basques | 94.1 /100 | #129 | Exceptional 95.4% |
| Jordanians | 93.5 /100 | #130 | Exceptional 95.3% |
| Immigrants | North Macedonia | 92.3 /100 | #131 | Exceptional 95.3% |
| Immigrants | Nonimmigrants | 92.0 /100 | #132 | Exceptional 95.3% |
| Israelis | 90.4 /100 | #133 | Exceptional 95.3% |
| Immigrants | Israel | 89.6 /100 | #134 | Excellent 95.3% |
| Immigrants | Belarus | 88.9 /100 | #135 | Excellent 95.2% |
| Immigrants | Iran | 88.3 /100 | #136 | Excellent 95.2% |
| Hmong | 87.7 /100 | #137 | Excellent 95.2% |
| Immigrants | Russia | 86.6 /100 | #138 | Excellent 95.2% |
| Immigrants | Eastern Europe | 85.8 /100 | #139 | Excellent 95.2% |
| Immigrants | Taiwan | 85.3 /100 | #140 | Excellent 95.2% |
| Immigrants | Bosnia and Herzegovina | 85.2 /100 | #141 | Excellent 95.2% |
| Immigrants | Greece | 84.6 /100 | #142 | Excellent 95.2% |