Irish vs Immigrants from Argentina Unemployment Among Ages 20 to 24 years
COMPARE
Irish
Immigrants from Argentina
Unemployment Among Ages 20 to 24 years
Unemployment Among Ages 20 to 24 years Comparison
Irish
Immigrants from Argentina
10.0%
UNEMPLOYMENT AMONG AGES 20 TO 24 YEARS
94.3/ 100
METRIC RATING
103rd/ 347
METRIC RANK
10.0%
UNEMPLOYMENT AMONG AGES 20 TO 24 YEARS
94.9/ 100
METRIC RATING
102nd/ 347
METRIC RANK
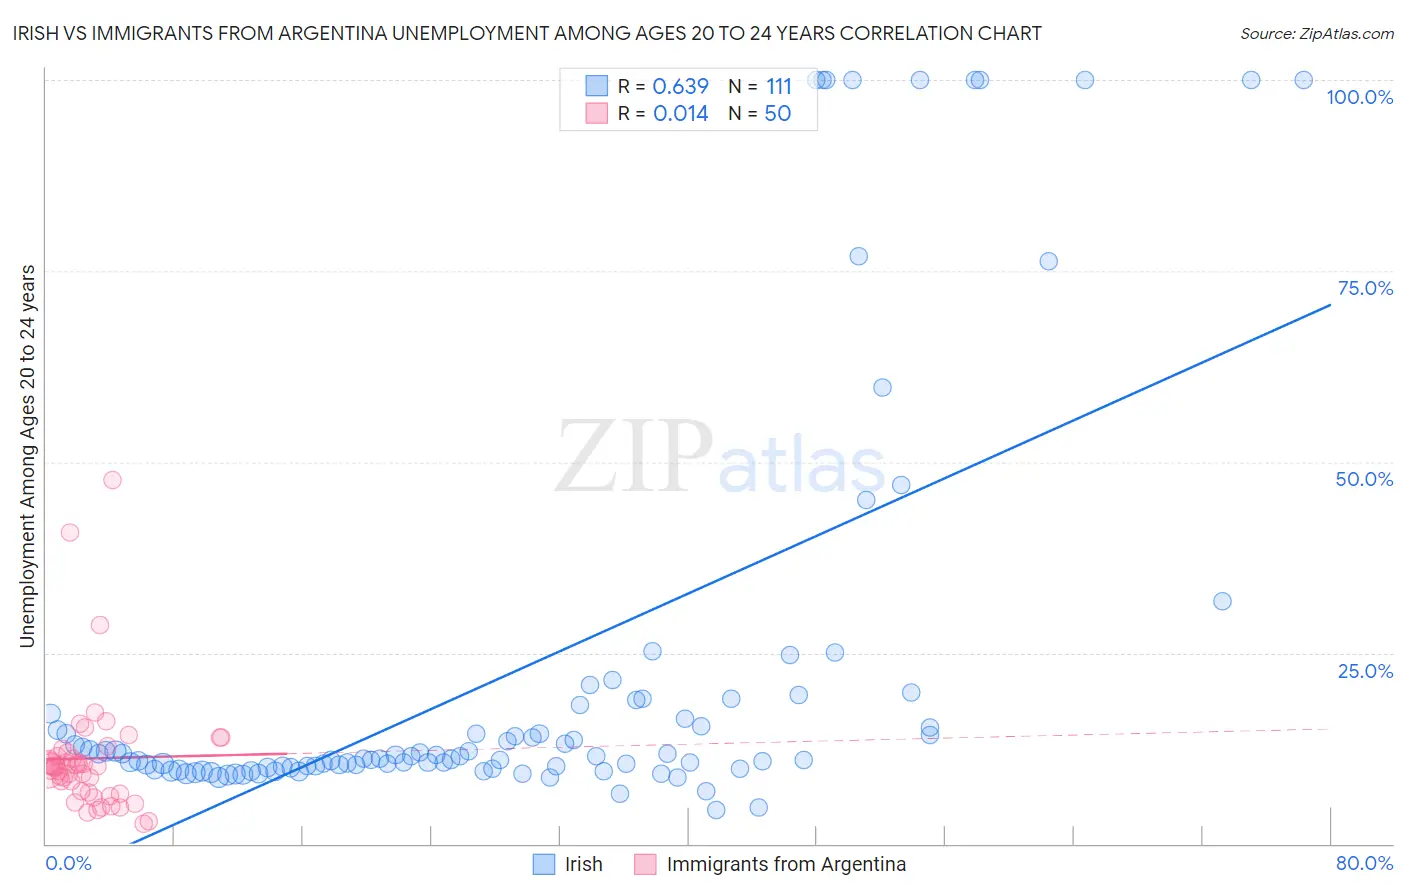
Irish vs Immigrants from Argentina Unemployment Among Ages 20 to 24 years Correlation Chart
The statistical analysis conducted on geographies consisting of 527,401,153 people shows a significant positive correlation between the proportion of Irish and unemployment rate among population between the ages 20 and 24 in the United States with a correlation coefficient (R) of 0.639 and weighted average of 10.0%. Similarly, the statistical analysis conducted on geographies consisting of 260,290,085 people shows no correlation between the proportion of Immigrants from Argentina and unemployment rate among population between the ages 20 and 24 in the United States with a correlation coefficient (R) of 0.014 and weighted average of 10.0%, a difference of 0.11%.
Unemployment Among Ages 20 to 24 years Correlation Summary
| Measurement | Irish | Immigrants from Argentina |
| Minimum | 4.4% | 2.6% |
| Maximum | 100.0% | 47.6% |
| Range | 95.6% | 45.0% |
| Mean | 22.4% | 11.2% |
| Median | 11.4% | 10.0% |
| Interquartile 25% (IQ1) | 9.9% | 6.8% |
| Interquartile 75% (IQ3) | 17.1% | 12.0% |
| Interquartile Range (IQR) | 7.2% | 5.2% |
| Standard Deviation (Sample) | 27.0% | 8.1% |
| Standard Deviation (Population) | 26.9% | 8.0% |
Demographics Similar to Irish and Immigrants from Argentina by Unemployment Among Ages 20 to 24 years
In terms of unemployment among ages 20 to 24 years, the demographic groups most similar to Irish are Immigrants from Chile (10.0%, a difference of 0.040%), Immigrants from Hungary (10.0%, a difference of 0.050%), Pennsylvania German (10.0%, a difference of 0.070%), Iroquois (10.1%, a difference of 0.14%), and Laotian (10.0%, a difference of 0.16%). Similarly, the demographic groups most similar to Immigrants from Argentina are Laotian (10.0%, a difference of 0.050%), Immigrants from France (10.0%, a difference of 0.080%), Fijian (10.0%, a difference of 0.090%), Japanese (10.0%, a difference of 0.10%), and Immigrants from Chile (10.0%, a difference of 0.15%).
| Demographics | Rating | Rank | Unemployment Among Ages 20 to 24 years |
| Bangladeshis | 96.9 /100 | #92 | Exceptional 10.0% |
| Immigrants | Malaysia | 96.9 /100 | #93 | Exceptional 10.0% |
| Immigrants | Micronesia | 96.6 /100 | #94 | Exceptional 10.0% |
| Scotch-Irish | 96.2 /100 | #95 | Exceptional 10.0% |
| Thais | 96.2 /100 | #96 | Exceptional 10.0% |
| Slavs | 96.1 /100 | #97 | Exceptional 10.0% |
| Japanese | 95.4 /100 | #98 | Exceptional 10.0% |
| Fijians | 95.3 /100 | #99 | Exceptional 10.0% |
| Immigrants | France | 95.2 /100 | #100 | Exceptional 10.0% |
| Laotians | 95.1 /100 | #101 | Exceptional 10.0% |
| Immigrants | Argentina | 94.9 /100 | #102 | Exceptional 10.0% |
| Irish | 94.3 /100 | #103 | Exceptional 10.0% |
| Immigrants | Chile | 94.0 /100 | #104 | Exceptional 10.0% |
| Immigrants | Hungary | 94.0 /100 | #105 | Exceptional 10.0% |
| Pennsylvania Germans | 93.9 /100 | #106 | Exceptional 10.0% |
| Iroquois | 93.4 /100 | #107 | Exceptional 10.1% |
| Immigrants | Latvia | 93.2 /100 | #108 | Exceptional 10.1% |
| Filipinos | 93.2 /100 | #109 | Exceptional 10.1% |
| Immigrants | Spain | 93.1 /100 | #110 | Exceptional 10.1% |
| Immigrants | Indonesia | 92.7 /100 | #111 | Exceptional 10.1% |
| Northern Europeans | 92.7 /100 | #112 | Exceptional 10.1% |