Immigrants from Bosnia and Herzegovina vs Cuban Associate's Degree
COMPARE
Immigrants from Bosnia and Herzegovina
Cuban
Associate's Degree
Associate's Degree Comparison
Immigrants from Bosnia and Herzegovina
Cubans
46.3%
ASSOCIATE'S DEGREE
48.3/ 100
METRIC RATING
178th/ 347
METRIC RANK
41.9%
ASSOCIATE'S DEGREE
0.6/ 100
METRIC RATING
254th/ 347
METRIC RANK
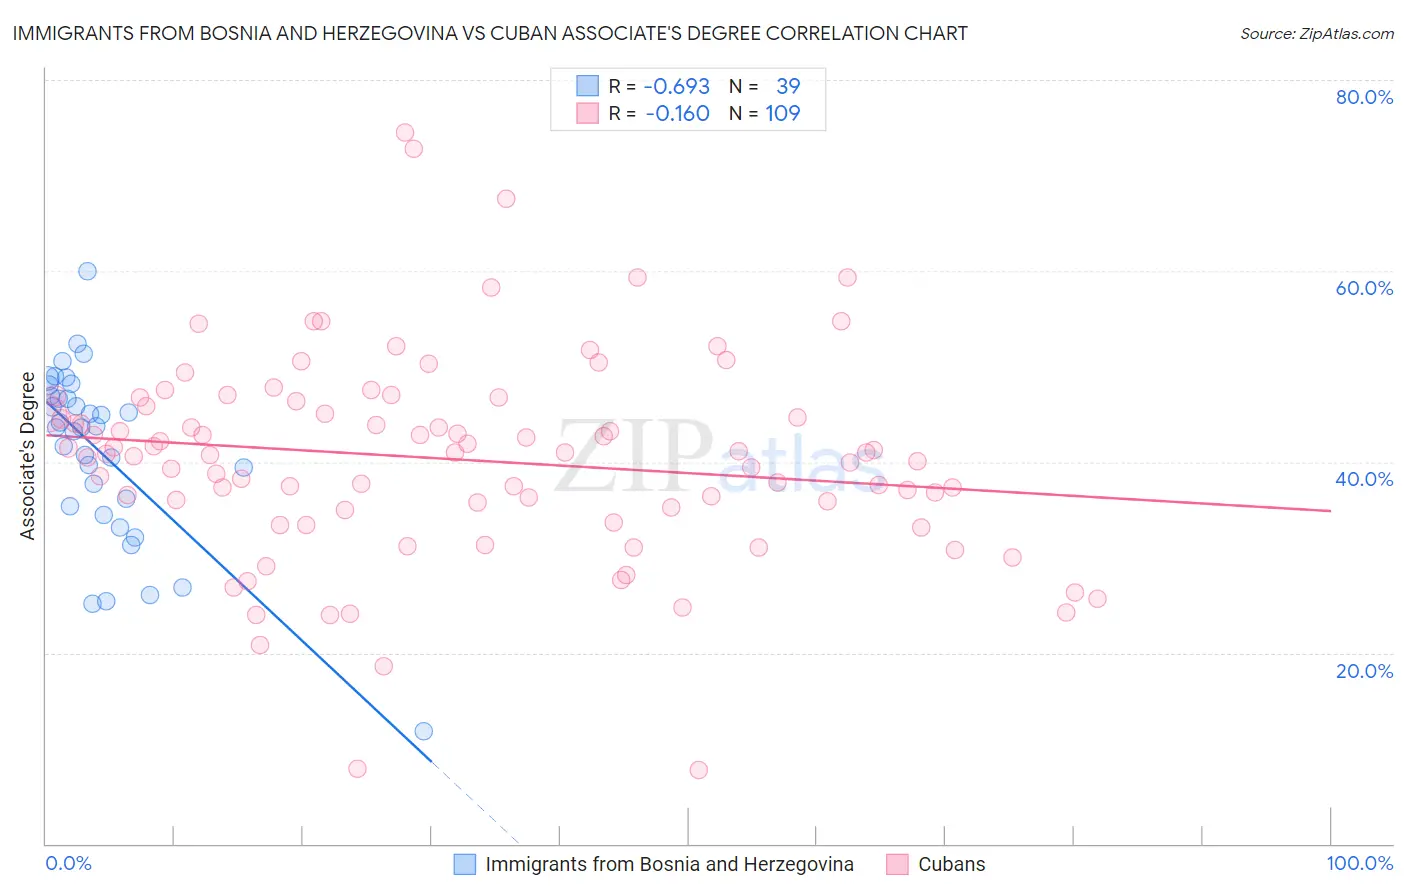
Immigrants from Bosnia and Herzegovina vs Cuban Associate's Degree Correlation Chart
The statistical analysis conducted on geographies consisting of 156,817,312 people shows a significant negative correlation between the proportion of Immigrants from Bosnia and Herzegovina and percentage of population with at least associate's degree education in the United States with a correlation coefficient (R) of -0.693 and weighted average of 46.3%. Similarly, the statistical analysis conducted on geographies consisting of 449,326,407 people shows a poor negative correlation between the proportion of Cubans and percentage of population with at least associate's degree education in the United States with a correlation coefficient (R) of -0.160 and weighted average of 41.9%, a difference of 10.5%.
Associate's Degree Correlation Summary
| Measurement | Immigrants from Bosnia and Herzegovina | Cuban |
| Minimum | 11.8% | 7.8% |
| Maximum | 59.9% | 74.4% |
| Range | 48.2% | 66.7% |
| Mean | 41.0% | 40.3% |
| Median | 43.6% | 41.0% |
| Interquartile 25% (IQ1) | 35.3% | 35.1% |
| Interquartile 75% (IQ3) | 46.9% | 46.0% |
| Interquartile Range (IQR) | 11.5% | 10.9% |
| Standard Deviation (Sample) | 9.4% | 10.9% |
| Standard Deviation (Population) | 9.2% | 10.8% |
Similar Demographics by Associate's Degree
Demographics Similar to Immigrants from Bosnia and Herzegovina by Associate's Degree
In terms of associate's degree, the demographic groups most similar to Immigrants from Bosnia and Herzegovina are Slovak (46.3%, a difference of 0.010%), Finnish (46.3%, a difference of 0.020%), Belgian (46.3%, a difference of 0.040%), Sri Lankan (46.3%, a difference of 0.050%), and English (46.4%, a difference of 0.13%).
| Demographics | Rating | Rank | Associate's Degree |
| Basques | 52.8 /100 | #171 | Average 46.5% |
| Peruvians | 50.5 /100 | #172 | Average 46.4% |
| Immigrants | Iraq | 50.3 /100 | #173 | Average 46.4% |
| English | 50.0 /100 | #174 | Average 46.4% |
| Belgians | 48.9 /100 | #175 | Average 46.3% |
| Finns | 48.5 /100 | #176 | Average 46.3% |
| Slovaks | 48.4 /100 | #177 | Average 46.3% |
| Immigrants | Bosnia and Herzegovina | 48.3 /100 | #178 | Average 46.3% |
| Sri Lankans | 47.6 /100 | #179 | Average 46.3% |
| Bermudans | 46.4 /100 | #180 | Average 46.2% |
| Immigrants | Colombia | 41.3 /100 | #181 | Average 46.0% |
| Swiss | 40.4 /100 | #182 | Average 46.0% |
| Yugoslavians | 40.2 /100 | #183 | Average 46.0% |
| Czechoslovakians | 40.0 /100 | #184 | Average 46.0% |
| Costa Ricans | 38.6 /100 | #185 | Fair 46.0% |
Demographics Similar to Cubans by Associate's Degree
In terms of associate's degree, the demographic groups most similar to Cubans are Indonesian (41.9%, a difference of 0.060%), Immigrants from Guyana (41.8%, a difference of 0.090%), French American Indian (42.0%, a difference of 0.17%), Immigrants from Congo (41.8%, a difference of 0.21%), and Spanish American (41.8%, a difference of 0.27%).
| Demographics | Rating | Rank | Associate's Degree |
| Immigrants | Fiji | 0.8 /100 | #247 | Tragic 42.2% |
| Immigrants | Ecuador | 0.8 /100 | #248 | Tragic 42.2% |
| Jamaicans | 0.7 /100 | #249 | Tragic 42.1% |
| U.S. Virgin Islanders | 0.7 /100 | #250 | Tragic 42.1% |
| Immigrants | Bahamas | 0.7 /100 | #251 | Tragic 42.1% |
| French American Indians | 0.6 /100 | #252 | Tragic 42.0% |
| Indonesians | 0.6 /100 | #253 | Tragic 41.9% |
| Cubans | 0.6 /100 | #254 | Tragic 41.9% |
| Immigrants | Guyana | 0.5 /100 | #255 | Tragic 41.8% |
| Immigrants | Congo | 0.5 /100 | #256 | Tragic 41.8% |
| Spanish Americans | 0.5 /100 | #257 | Tragic 41.8% |
| Japanese | 0.5 /100 | #258 | Tragic 41.7% |
| Malaysians | 0.4 /100 | #259 | Tragic 41.6% |
| Marshallese | 0.4 /100 | #260 | Tragic 41.6% |
| Nicaraguans | 0.4 /100 | #261 | Tragic 41.5% |