Austrian vs Immigrants from Taiwan 7th Grade
COMPARE
Austrian
Immigrants from Taiwan
7th Grade
7th Grade Comparison
Austrians
Immigrants from Taiwan
97.0%
7TH GRADE
99.8/ 100
METRIC RATING
53rd/ 347
METRIC RANK
96.1%
7TH GRADE
61.5/ 100
METRIC RATING
165th/ 347
METRIC RANK
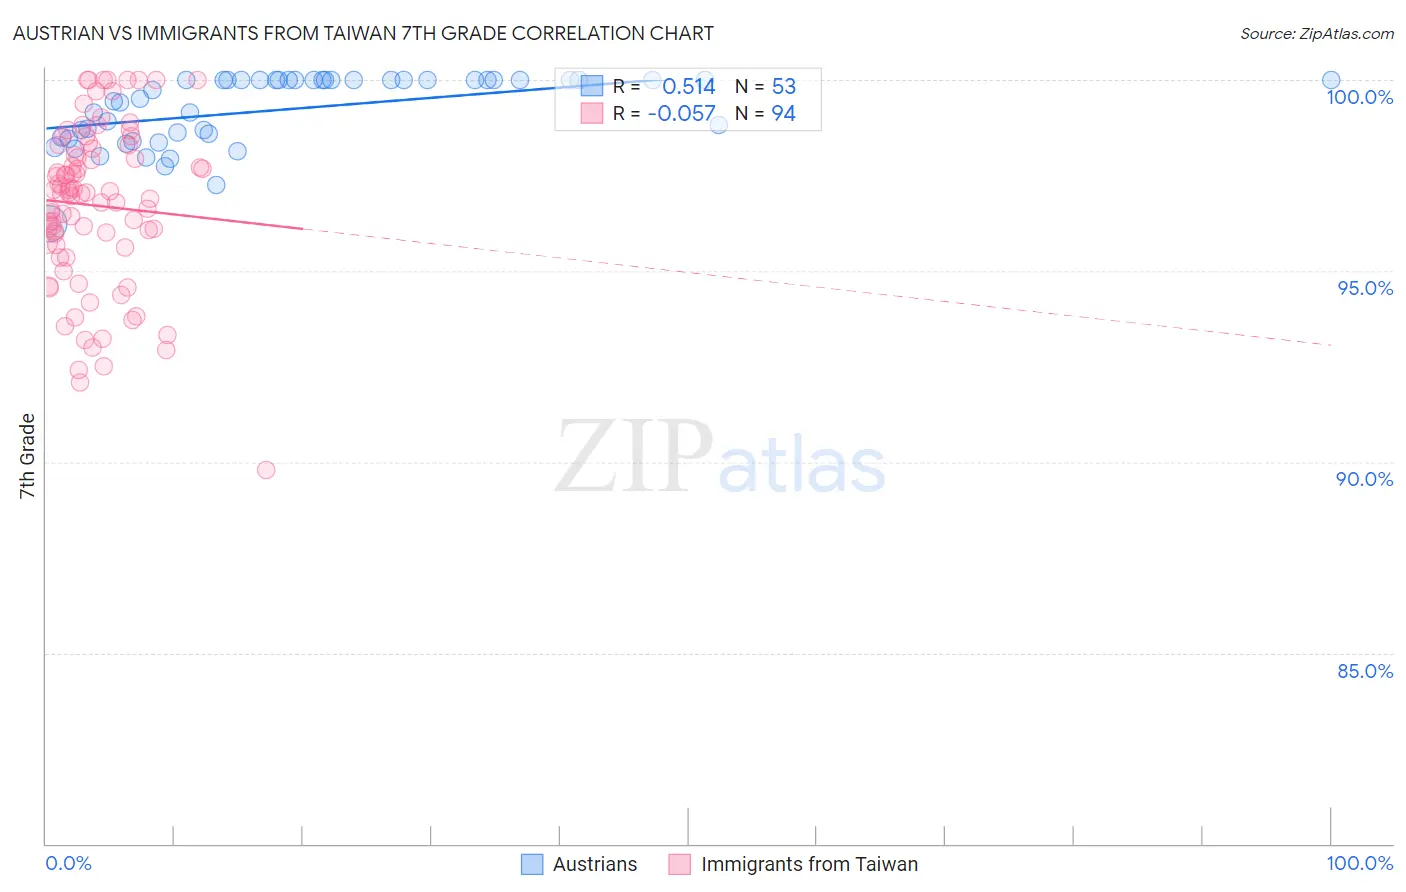
Austrian vs Immigrants from Taiwan 7th Grade Correlation Chart
The statistical analysis conducted on geographies consisting of 452,080,344 people shows a substantial positive correlation between the proportion of Austrians and percentage of population with at least 7th grade education in the United States with a correlation coefficient (R) of 0.514 and weighted average of 97.0%. Similarly, the statistical analysis conducted on geographies consisting of 298,069,199 people shows a slight negative correlation between the proportion of Immigrants from Taiwan and percentage of population with at least 7th grade education in the United States with a correlation coefficient (R) of -0.057 and weighted average of 96.1%, a difference of 0.92%.
7th Grade Correlation Summary
| Measurement | Austrian | Immigrants from Taiwan |
| Minimum | 96.3% | 89.8% |
| Maximum | 100.0% | 100.0% |
| Range | 3.7% | 10.2% |
| Mean | 99.2% | 96.7% |
| Median | 99.7% | 97.0% |
| Interquartile 25% (IQ1) | 98.5% | 95.7% |
| Interquartile 75% (IQ3) | 100.0% | 98.2% |
| Interquartile Range (IQR) | 1.5% | 2.5% |
| Standard Deviation (Sample) | 0.92% | 2.1% |
| Standard Deviation (Population) | 0.91% | 2.1% |
Similar Demographics by 7th Grade
Demographics Similar to Austrians by 7th Grade
In terms of 7th grade, the demographic groups most similar to Austrians are Greek (97.0%, a difference of 0.010%), Australian (97.0%, a difference of 0.010%), Estonian (97.0%, a difference of 0.030%), Russian (97.0%, a difference of 0.030%), and Serbian (97.0%, a difference of 0.030%).
| Demographics | Rating | Rank | 7th Grade |
| Aleuts | 99.9 /100 | #46 | Exceptional 97.1% |
| Bulgarians | 99.9 /100 | #47 | Exceptional 97.1% |
| Celtics | 99.9 /100 | #48 | Exceptional 97.1% |
| Slavs | 99.9 /100 | #49 | Exceptional 97.1% |
| Immigrants | Scotland | 99.9 /100 | #50 | Exceptional 97.1% |
| Estonians | 99.9 /100 | #51 | Exceptional 97.0% |
| Greeks | 99.9 /100 | #52 | Exceptional 97.0% |
| Austrians | 99.8 /100 | #53 | Exceptional 97.0% |
| Australians | 99.8 /100 | #54 | Exceptional 97.0% |
| Russians | 99.8 /100 | #55 | Exceptional 97.0% |
| Serbians | 99.8 /100 | #56 | Exceptional 97.0% |
| Americans | 99.8 /100 | #57 | Exceptional 97.0% |
| Whites/Caucasians | 99.8 /100 | #58 | Exceptional 97.0% |
| Macedonians | 99.8 /100 | #59 | Exceptional 97.0% |
| Immigrants | Canada | 99.8 /100 | #60 | Exceptional 96.9% |
Demographics Similar to Immigrants from Taiwan by 7th Grade
In terms of 7th grade, the demographic groups most similar to Immigrants from Taiwan are Immigrants from Italy (96.1%, a difference of 0.0%), Immigrants from Kazakhstan (96.1%, a difference of 0.0%), Spaniard (96.1%, a difference of 0.010%), Immigrants from Sri Lanka (96.1%, a difference of 0.010%), and Pima (96.1%, a difference of 0.020%).
| Demographics | Rating | Rank | 7th Grade |
| Arabs | 68.6 /100 | #158 | Good 96.2% |
| Alsatians | 67.2 /100 | #159 | Good 96.1% |
| Immigrants | Kenya | 66.8 /100 | #160 | Good 96.1% |
| Bermudans | 66.3 /100 | #161 | Good 96.1% |
| Pima | 64.3 /100 | #162 | Good 96.1% |
| Spaniards | 62.6 /100 | #163 | Good 96.1% |
| Immigrants | Italy | 62.1 /100 | #164 | Good 96.1% |
| Immigrants | Taiwan | 61.5 /100 | #165 | Good 96.1% |
| Immigrants | Kazakhstan | 61.0 /100 | #166 | Good 96.1% |
| Immigrants | Sri Lanka | 59.9 /100 | #167 | Average 96.1% |
| Immigrants | Poland | 59.0 /100 | #168 | Average 96.1% |
| Ute | 55.8 /100 | #169 | Average 96.1% |
| Immigrants | Ukraine | 55.0 /100 | #170 | Average 96.1% |
| Egyptians | 54.2 /100 | #171 | Average 96.1% |
| Venezuelans | 51.4 /100 | #172 | Average 96.0% |