Immigrants from West Indies vs Malaysian Bachelor's Degree
COMPARE
Immigrants from West Indies
Malaysian
Bachelor's Degree
Bachelor's Degree Comparison
Immigrants from West Indies
Malaysians
34.6%
BACHELOR'S DEGREE
2.9/ 100
METRIC RATING
235th/ 347
METRIC RANK
32.9%
BACHELOR'S DEGREE
0.5/ 100
METRIC RATING
260th/ 347
METRIC RANK
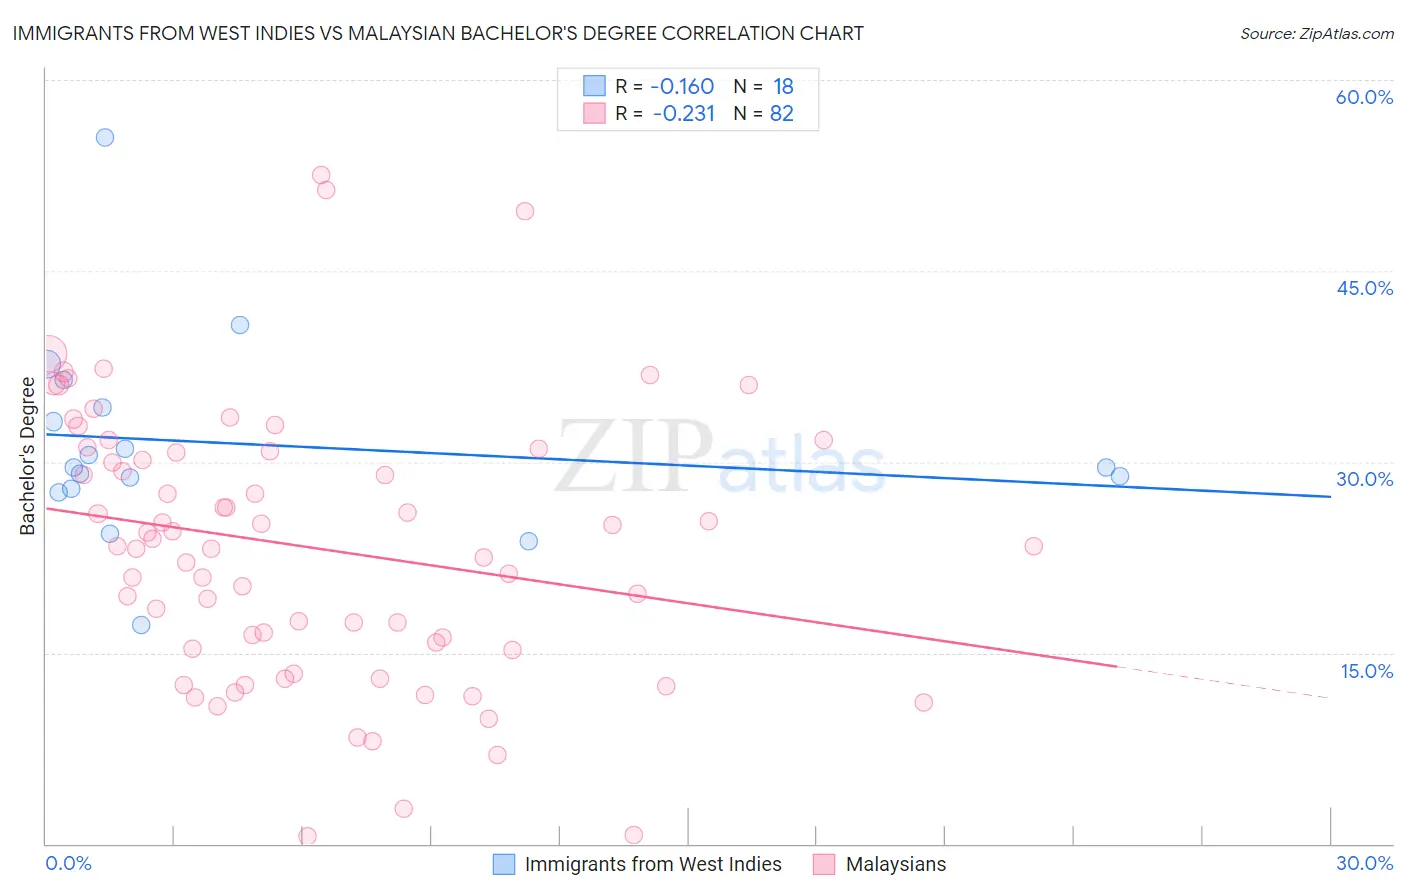
Immigrants from West Indies vs Malaysian Bachelor's Degree Correlation Chart
The statistical analysis conducted on geographies consisting of 72,420,477 people shows a poor negative correlation between the proportion of Immigrants from West Indies and percentage of population with at least bachelor's degree education in the United States with a correlation coefficient (R) of -0.160 and weighted average of 34.6%. Similarly, the statistical analysis conducted on geographies consisting of 226,101,467 people shows a weak negative correlation between the proportion of Malaysians and percentage of population with at least bachelor's degree education in the United States with a correlation coefficient (R) of -0.231 and weighted average of 32.9%, a difference of 5.1%.
Bachelor's Degree Correlation Summary
| Measurement | Immigrants from West Indies | Malaysian |
| Minimum | 17.2% | 0.56% |
| Maximum | 55.5% | 52.5% |
| Range | 38.3% | 51.9% |
| Mean | 31.4% | 23.3% |
| Median | 29.5% | 23.4% |
| Interquartile 25% (IQ1) | 27.8% | 15.3% |
| Interquartile 75% (IQ3) | 34.3% | 30.9% |
| Interquartile Range (IQR) | 6.4% | 15.6% |
| Standard Deviation (Sample) | 8.1% | 10.7% |
| Standard Deviation (Population) | 7.8% | 10.7% |
Similar Demographics by Bachelor's Degree
Demographics Similar to Immigrants from West Indies by Bachelor's Degree
In terms of bachelor's degree, the demographic groups most similar to Immigrants from West Indies are Guamanian/Chamorro (34.6%, a difference of 0.090%), Liberian (34.6%, a difference of 0.11%), Tlingit-Haida (34.6%, a difference of 0.14%), Immigrants from Ecuador (34.7%, a difference of 0.31%), and Hmong (34.8%, a difference of 0.42%).
| Demographics | Rating | Rank | Bachelor's Degree |
| Immigrants | Trinidad and Tobago | 6.0 /100 | #228 | Tragic 35.3% |
| Whites/Caucasians | 5.9 /100 | #229 | Tragic 35.3% |
| Immigrants | Grenada | 4.3 /100 | #230 | Tragic 35.0% |
| Immigrants | St. Vincent and the Grenadines | 4.3 /100 | #231 | Tragic 35.0% |
| Hmong | 3.4 /100 | #232 | Tragic 34.8% |
| Immigrants | Ecuador | 3.3 /100 | #233 | Tragic 34.7% |
| Guamanians/Chamorros | 3.0 /100 | #234 | Tragic 34.6% |
| Immigrants | West Indies | 2.9 /100 | #235 | Tragic 34.6% |
| Liberians | 2.8 /100 | #236 | Tragic 34.6% |
| Tlingit-Haida | 2.8 /100 | #237 | Tragic 34.6% |
| Guyanese | 2.5 /100 | #238 | Tragic 34.5% |
| British West Indians | 2.5 /100 | #239 | Tragic 34.5% |
| Tongans | 2.0 /100 | #240 | Tragic 34.3% |
| Immigrants | Cambodia | 1.9 /100 | #241 | Tragic 34.2% |
| Immigrants | Nonimmigrants | 1.8 /100 | #242 | Tragic 34.2% |
Demographics Similar to Malaysians by Bachelor's Degree
In terms of bachelor's degree, the demographic groups most similar to Malaysians are African (32.9%, a difference of 0.090%), Immigrants from Jamaica (32.9%, a difference of 0.090%), Osage (33.0%, a difference of 0.36%), Belizean (32.8%, a difference of 0.38%), and French American Indian (33.1%, a difference of 0.41%).
| Demographics | Rating | Rank | Bachelor's Degree |
| U.S. Virgin Islanders | 0.7 /100 | #253 | Tragic 33.2% |
| Native Hawaiians | 0.7 /100 | #254 | Tragic 33.2% |
| Iroquois | 0.7 /100 | #255 | Tragic 33.2% |
| Nicaraguans | 0.6 /100 | #256 | Tragic 33.1% |
| Spanish Americans | 0.6 /100 | #257 | Tragic 33.1% |
| French American Indians | 0.6 /100 | #258 | Tragic 33.1% |
| Osage | 0.5 /100 | #259 | Tragic 33.0% |
| Malaysians | 0.5 /100 | #260 | Tragic 32.9% |
| Africans | 0.5 /100 | #261 | Tragic 32.9% |
| Immigrants | Jamaica | 0.5 /100 | #262 | Tragic 32.9% |
| Belizeans | 0.4 /100 | #263 | Tragic 32.8% |
| Central American Indians | 0.3 /100 | #264 | Tragic 32.5% |
| Bahamians | 0.3 /100 | #265 | Tragic 32.5% |
| Immigrants | Dominica | 0.3 /100 | #266 | Tragic 32.5% |
| Cubans | 0.3 /100 | #267 | Tragic 32.5% |