Immigrants from Afghanistan vs Malaysian Bachelor's Degree
COMPARE
Immigrants from Afghanistan
Malaysian
Bachelor's Degree
Bachelor's Degree Comparison
Immigrants from Afghanistan
Malaysians
39.1%
BACHELOR'S DEGREE
79.7/ 100
METRIC RATING
144th/ 347
METRIC RANK
32.9%
BACHELOR'S DEGREE
0.5/ 100
METRIC RATING
260th/ 347
METRIC RANK
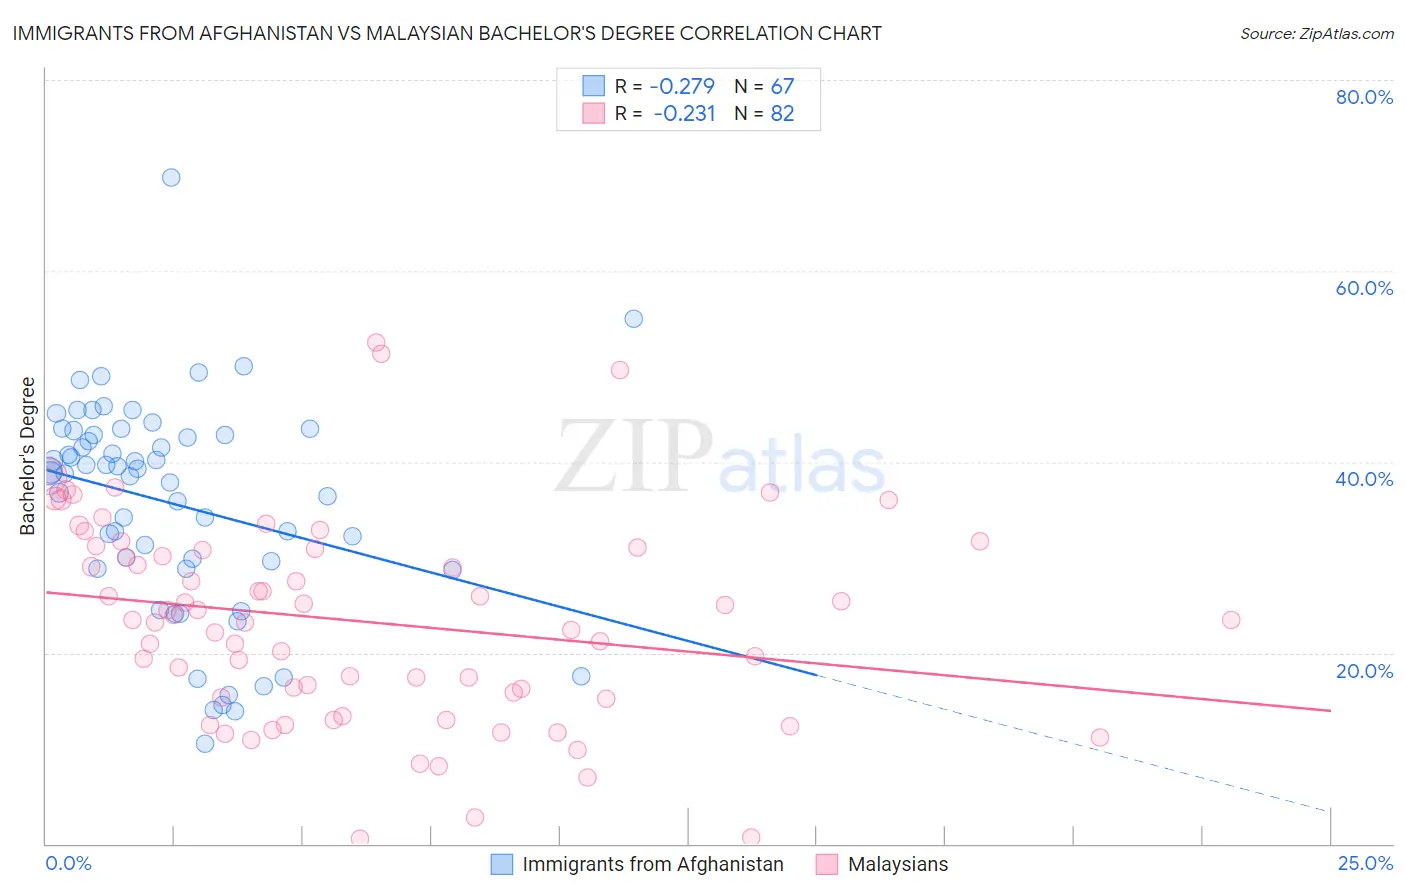
Immigrants from Afghanistan vs Malaysian Bachelor's Degree Correlation Chart
The statistical analysis conducted on geographies consisting of 147,641,942 people shows a weak negative correlation between the proportion of Immigrants from Afghanistan and percentage of population with at least bachelor's degree education in the United States with a correlation coefficient (R) of -0.279 and weighted average of 39.1%. Similarly, the statistical analysis conducted on geographies consisting of 226,101,467 people shows a weak negative correlation between the proportion of Malaysians and percentage of population with at least bachelor's degree education in the United States with a correlation coefficient (R) of -0.231 and weighted average of 32.9%, a difference of 18.7%.
Bachelor's Degree Correlation Summary
| Measurement | Immigrants from Afghanistan | Malaysian |
| Minimum | 10.5% | 0.56% |
| Maximum | 69.8% | 52.5% |
| Range | 59.3% | 51.9% |
| Mean | 35.6% | 23.3% |
| Median | 38.9% | 23.4% |
| Interquartile 25% (IQ1) | 28.9% | 15.3% |
| Interquartile 75% (IQ3) | 42.9% | 30.9% |
| Interquartile Range (IQR) | 14.0% | 15.6% |
| Standard Deviation (Sample) | 11.2% | 10.7% |
| Standard Deviation (Population) | 11.2% | 10.7% |
Similar Demographics by Bachelor's Degree
Demographics Similar to Immigrants from Afghanistan by Bachelor's Degree
In terms of bachelor's degree, the demographic groups most similar to Immigrants from Afghanistan are Polish (39.1%, a difference of 0.020%), Slovene (39.1%, a difference of 0.030%), Swedish (39.1%, a difference of 0.070%), Immigrants from Sierra Leone (39.0%, a difference of 0.10%), and Iraqi (39.0%, a difference of 0.24%).
| Demographics | Rating | Rank | Bachelor's Degree |
| Icelanders | 86.5 /100 | #137 | Excellent 39.5% |
| Europeans | 85.6 /100 | #138 | Excellent 39.5% |
| Immigrants | Sudan | 84.5 /100 | #139 | Excellent 39.4% |
| Immigrants | Armenia | 84.1 /100 | #140 | Excellent 39.4% |
| South American Indians | 83.6 /100 | #141 | Excellent 39.3% |
| Immigrants | North Macedonia | 81.6 /100 | #142 | Excellent 39.2% |
| Poles | 79.8 /100 | #143 | Good 39.1% |
| Immigrants | Afghanistan | 79.7 /100 | #144 | Good 39.1% |
| Slovenes | 79.5 /100 | #145 | Good 39.1% |
| Swedes | 79.2 /100 | #146 | Good 39.1% |
| Immigrants | Sierra Leone | 79.0 /100 | #147 | Good 39.0% |
| Iraqis | 78.1 /100 | #148 | Good 39.0% |
| Immigrants | Poland | 77.5 /100 | #149 | Good 39.0% |
| South Americans | 77.3 /100 | #150 | Good 38.9% |
| Immigrants | Africa | 76.5 /100 | #151 | Good 38.9% |
Demographics Similar to Malaysians by Bachelor's Degree
In terms of bachelor's degree, the demographic groups most similar to Malaysians are African (32.9%, a difference of 0.090%), Immigrants from Jamaica (32.9%, a difference of 0.090%), Osage (33.0%, a difference of 0.36%), Belizean (32.8%, a difference of 0.38%), and French American Indian (33.1%, a difference of 0.41%).
| Demographics | Rating | Rank | Bachelor's Degree |
| U.S. Virgin Islanders | 0.7 /100 | #253 | Tragic 33.2% |
| Native Hawaiians | 0.7 /100 | #254 | Tragic 33.2% |
| Iroquois | 0.7 /100 | #255 | Tragic 33.2% |
| Nicaraguans | 0.6 /100 | #256 | Tragic 33.1% |
| Spanish Americans | 0.6 /100 | #257 | Tragic 33.1% |
| French American Indians | 0.6 /100 | #258 | Tragic 33.1% |
| Osage | 0.5 /100 | #259 | Tragic 33.0% |
| Malaysians | 0.5 /100 | #260 | Tragic 32.9% |
| Africans | 0.5 /100 | #261 | Tragic 32.9% |
| Immigrants | Jamaica | 0.5 /100 | #262 | Tragic 32.9% |
| Belizeans | 0.4 /100 | #263 | Tragic 32.8% |
| Central American Indians | 0.3 /100 | #264 | Tragic 32.5% |
| Bahamians | 0.3 /100 | #265 | Tragic 32.5% |
| Immigrants | Dominica | 0.3 /100 | #266 | Tragic 32.5% |
| Cubans | 0.3 /100 | #267 | Tragic 32.5% |