Inupiat vs Immigrants from Oceania Unemployment Among Ages 55 to 59 years
COMPARE
Inupiat
Immigrants from Oceania
Unemployment Among Ages 55 to 59 years
Unemployment Among Ages 55 to 59 years Comparison
Inupiat
Immigrants from Oceania
9.0%
UNEMPLOYMENT AMONG AGES 55 TO 59 YEARS
0.0/ 100
METRIC RATING
344th/ 347
METRIC RANK
4.7%
UNEMPLOYMENT AMONG AGES 55 TO 59 YEARS
94.0/ 100
METRIC RATING
103rd/ 347
METRIC RANK
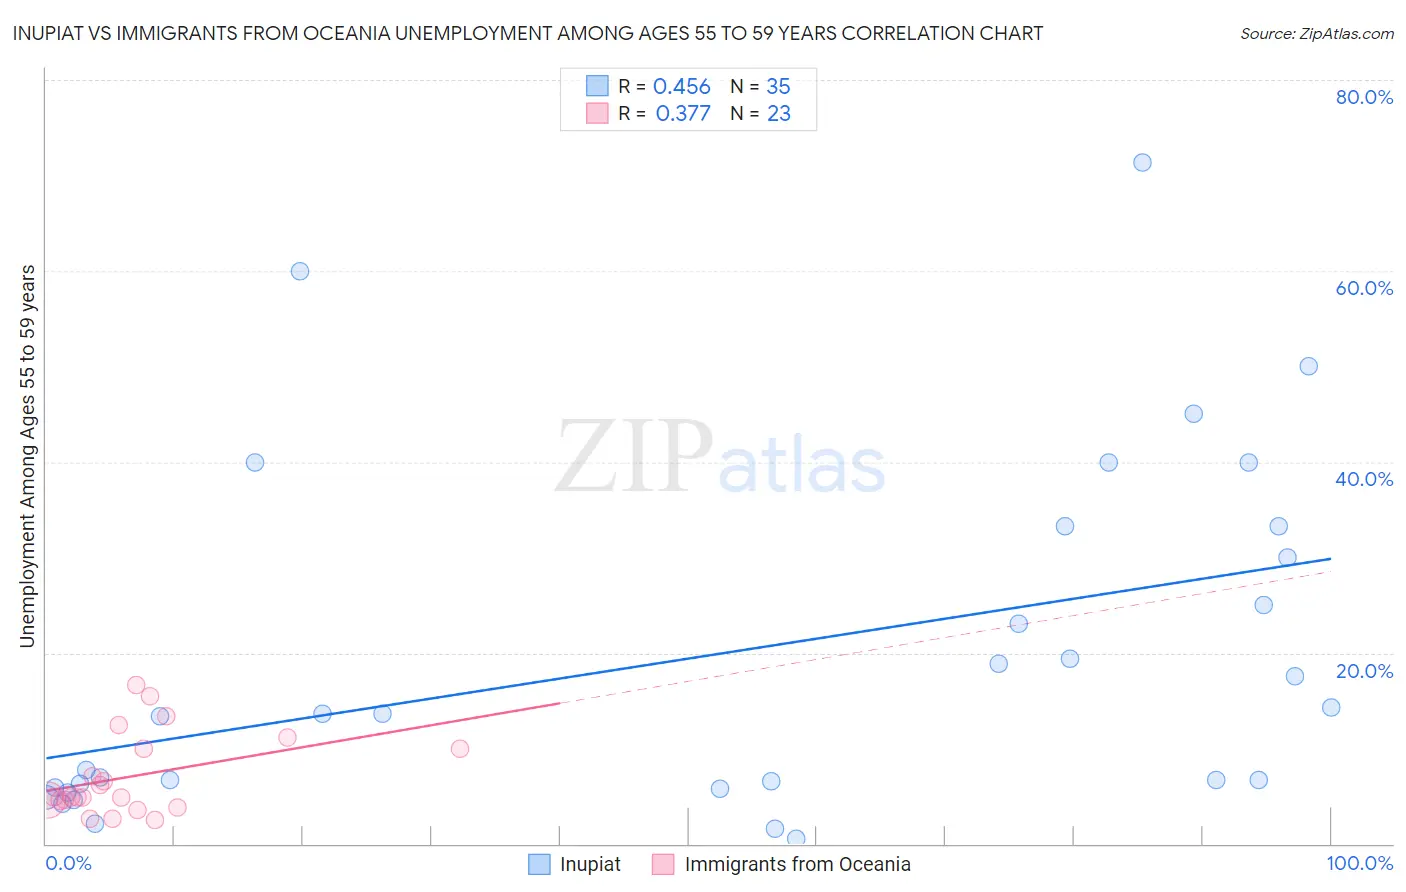
Inupiat vs Immigrants from Oceania Unemployment Among Ages 55 to 59 years Correlation Chart
The statistical analysis conducted on geographies consisting of 93,729,487 people shows a moderate positive correlation between the proportion of Inupiat and unemployment rate among population between the ages 55 and 59 in the United States with a correlation coefficient (R) of 0.456 and weighted average of 9.0%. Similarly, the statistical analysis conducted on geographies consisting of 288,398,346 people shows a mild positive correlation between the proportion of Immigrants from Oceania and unemployment rate among population between the ages 55 and 59 in the United States with a correlation coefficient (R) of 0.377 and weighted average of 4.7%, a difference of 93.0%.
Unemployment Among Ages 55 to 59 years Correlation Summary
| Measurement | Inupiat | Immigrants from Oceania |
| Minimum | 0.50% | 2.5% |
| Maximum | 71.4% | 16.6% |
| Range | 70.9% | 14.1% |
| Mean | 19.5% | 7.0% |
| Median | 13.6% | 4.9% |
| Interquartile 25% (IQ1) | 6.0% | 4.5% |
| Interquartile 75% (IQ3) | 33.3% | 10.0% |
| Interquartile Range (IQR) | 27.3% | 5.5% |
| Standard Deviation (Sample) | 18.2% | 4.2% |
| Standard Deviation (Population) | 17.9% | 4.1% |
Similar Demographics by Unemployment Among Ages 55 to 59 years
Demographics Similar to Inupiat by Unemployment Among Ages 55 to 59 years
In terms of unemployment among ages 55 to 59 years, the demographic groups most similar to Inupiat are Yakama (8.9%, a difference of 1.2%), Tohono O'odham (9.3%, a difference of 3.0%), Hopi (8.1%, a difference of 11.3%), Menominee (10.5%, a difference of 16.6%), and Shoshone (7.4%, a difference of 22.6%).
| Demographics | Rating | Rank | Unemployment Among Ages 55 to 59 years |
| Pima | 0.0 /100 | #333 | Tragic 6.6% |
| Pueblo | 0.0 /100 | #334 | Tragic 6.7% |
| Colville | 0.0 /100 | #335 | Tragic 6.7% |
| Navajo | 0.0 /100 | #336 | Tragic 6.7% |
| Paiute | 0.0 /100 | #337 | Tragic 6.8% |
| Immigrants | Yemen | 0.0 /100 | #338 | Tragic 6.9% |
| Puerto Ricans | 0.0 /100 | #339 | Tragic 7.0% |
| Alaskan Athabascans | 0.0 /100 | #340 | Tragic 7.1% |
| Shoshone | 0.0 /100 | #341 | Tragic 7.4% |
| Hopi | 0.0 /100 | #342 | Tragic 8.1% |
| Yakama | 0.0 /100 | #343 | Tragic 8.9% |
| Inupiat | 0.0 /100 | #344 | Tragic 9.0% |
| Tohono O'odham | 0.0 /100 | #345 | Tragic 9.3% |
| Menominee | 0.0 /100 | #346 | Tragic 10.5% |
| Yup'ik | 0.0 /100 | #347 | Tragic 13.9% |
Demographics Similar to Immigrants from Oceania by Unemployment Among Ages 55 to 59 years
In terms of unemployment among ages 55 to 59 years, the demographic groups most similar to Immigrants from Oceania are Canadian (4.7%, a difference of 0.0%), Immigrants from Turkey (4.7%, a difference of 0.020%), Immigrants from North America (4.7%, a difference of 0.030%), Immigrants from Laos (4.7%, a difference of 0.040%), and Celtic (4.7%, a difference of 0.050%).
| Demographics | Rating | Rank | Unemployment Among Ages 55 to 59 years |
| Immigrants | Belgium | 95.0 /100 | #96 | Exceptional 4.7% |
| Immigrants | Canada | 94.9 /100 | #97 | Exceptional 4.7% |
| Immigrants | Germany | 94.8 /100 | #98 | Exceptional 4.7% |
| Yugoslavians | 94.7 /100 | #99 | Exceptional 4.7% |
| Serbians | 94.4 /100 | #100 | Exceptional 4.7% |
| Celtics | 94.3 /100 | #101 | Exceptional 4.7% |
| Canadians | 94.1 /100 | #102 | Exceptional 4.7% |
| Immigrants | Oceania | 94.0 /100 | #103 | Exceptional 4.7% |
| Immigrants | Turkey | 93.9 /100 | #104 | Exceptional 4.7% |
| Immigrants | North America | 93.9 /100 | #105 | Exceptional 4.7% |
| Immigrants | Laos | 93.9 /100 | #106 | Exceptional 4.7% |
| Immigrants | Egypt | 93.5 /100 | #107 | Exceptional 4.7% |
| French | 93.3 /100 | #108 | Exceptional 4.7% |
| Chileans | 93.2 /100 | #109 | Exceptional 4.7% |
| Egyptians | 92.9 /100 | #110 | Exceptional 4.7% |