Inupiat vs Austrian Unemployment Among Ages 60 to 64 years
COMPARE
Inupiat
Austrian
Unemployment Among Ages 60 to 64 years
Unemployment Among Ages 60 to 64 years Comparison
Inupiat
Austrians
9.6%
UNEMPLOYMENT AMONG AGES 60 TO 64 YEARS
0.0/ 100
METRIC RATING
346th/ 347
METRIC RANK
4.8%
UNEMPLOYMENT AMONG AGES 60 TO 64 YEARS
91.9/ 100
METRIC RATING
127th/ 347
METRIC RANK
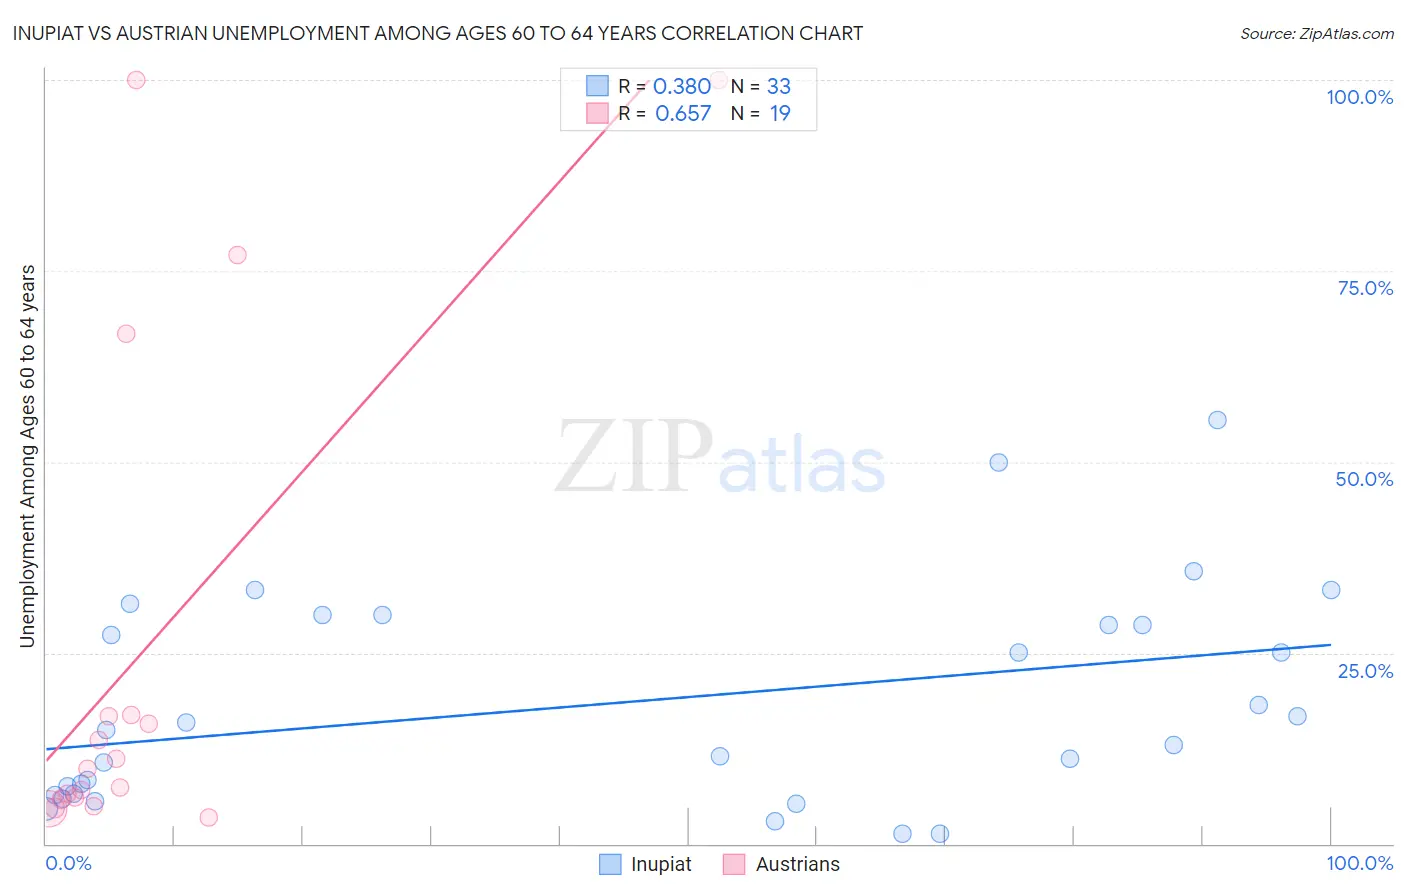
Inupiat vs Austrian Unemployment Among Ages 60 to 64 years Correlation Chart
The statistical analysis conducted on geographies consisting of 92,796,464 people shows a mild positive correlation between the proportion of Inupiat and unemployment rate among population between the ages 60 and 64 in the United States with a correlation coefficient (R) of 0.380 and weighted average of 9.6%. Similarly, the statistical analysis conducted on geographies consisting of 397,069,556 people shows a significant positive correlation between the proportion of Austrians and unemployment rate among population between the ages 60 and 64 in the United States with a correlation coefficient (R) of 0.657 and weighted average of 4.8%, a difference of 101.5%.
Unemployment Among Ages 60 to 64 years Correlation Summary
| Measurement | Inupiat | Austrian |
| Minimum | 1.3% | 3.5% |
| Maximum | 55.5% | 100.0% |
| Range | 54.2% | 96.5% |
| Mean | 18.5% | 25.2% |
| Median | 14.9% | 9.9% |
| Interquartile 25% (IQ1) | 6.5% | 5.8% |
| Interquartile 75% (IQ3) | 29.3% | 16.8% |
| Interquartile Range (IQR) | 22.8% | 11.0% |
| Standard Deviation (Sample) | 14.0% | 33.2% |
| Standard Deviation (Population) | 13.8% | 32.3% |
Similar Demographics by Unemployment Among Ages 60 to 64 years
Demographics Similar to Inupiat by Unemployment Among Ages 60 to 64 years
In terms of unemployment among ages 60 to 64 years, the demographic groups most similar to Inupiat are Alaskan Athabascan (8.4%, a difference of 14.2%), Yup'ik (11.9%, a difference of 24.4%), Alaska Native (7.6%, a difference of 25.6%), Immigrants from Yemen (6.8%, a difference of 40.3%), and Aleut (6.8%, a difference of 41.3%).
| Demographics | Rating | Rank | Unemployment Among Ages 60 to 64 years |
| Immigrants | Dominican Republic | 0.0 /100 | #333 | Tragic 6.0% |
| Puerto Ricans | 0.0 /100 | #334 | Tragic 6.1% |
| Vietnamese | 0.0 /100 | #335 | Tragic 6.1% |
| Kiowa | 0.0 /100 | #336 | Tragic 6.2% |
| Navajo | 0.0 /100 | #337 | Tragic 6.3% |
| Arapaho | 0.0 /100 | #338 | Tragic 6.3% |
| Tlingit-Haida | 0.0 /100 | #339 | Tragic 6.4% |
| Pueblo | 0.0 /100 | #340 | Tragic 6.7% |
| Yuman | 0.0 /100 | #341 | Tragic 6.8% |
| Aleuts | 0.0 /100 | #342 | Tragic 6.8% |
| Immigrants | Yemen | 0.0 /100 | #343 | Tragic 6.8% |
| Alaska Natives | 0.0 /100 | #344 | Tragic 7.6% |
| Alaskan Athabascans | 0.0 /100 | #345 | Tragic 8.4% |
| Inupiat | 0.0 /100 | #346 | Tragic 9.6% |
| Yup'ik | 0.0 /100 | #347 | Tragic 11.9% |
Demographics Similar to Austrians by Unemployment Among Ages 60 to 64 years
In terms of unemployment among ages 60 to 64 years, the demographic groups most similar to Austrians are Immigrants from South Central Asia (4.7%, a difference of 0.14%), Choctaw (4.8%, a difference of 0.18%), Immigrants from Serbia (4.8%, a difference of 0.18%), Immigrants from Syria (4.8%, a difference of 0.19%), and Immigrants from Thailand (4.7%, a difference of 0.24%).
| Demographics | Rating | Rank | Unemployment Among Ages 60 to 64 years |
| Macedonians | 95.7 /100 | #120 | Exceptional 4.7% |
| Albanians | 95.3 /100 | #121 | Exceptional 4.7% |
| Immigrants | Kazakhstan | 95.1 /100 | #122 | Exceptional 4.7% |
| Finns | 94.7 /100 | #123 | Exceptional 4.7% |
| Immigrants | Senegal | 94.5 /100 | #124 | Exceptional 4.7% |
| Immigrants | Thailand | 93.7 /100 | #125 | Exceptional 4.7% |
| Immigrants | South Central Asia | 93.0 /100 | #126 | Exceptional 4.7% |
| Austrians | 91.9 /100 | #127 | Exceptional 4.8% |
| Choctaw | 90.3 /100 | #128 | Exceptional 4.8% |
| Immigrants | Serbia | 90.2 /100 | #129 | Exceptional 4.8% |
| Immigrants | Syria | 90.1 /100 | #130 | Exceptional 4.8% |
| Immigrants | Lebanon | 89.6 /100 | #131 | Excellent 4.8% |
| Lithuanians | 89.6 /100 | #132 | Excellent 4.8% |
| Yaqui | 89.5 /100 | #133 | Excellent 4.8% |
| Basques | 88.8 /100 | #134 | Excellent 4.8% |