Indonesian vs Immigrants from Nepal 5th Grade
COMPARE
Indonesian
Immigrants from Nepal
5th Grade
5th Grade Comparison
Indonesians
Immigrants from Nepal
96.0%
5TH GRADE
0.0/ 100
METRIC RATING
310th/ 347
METRIC RANK
97.1%
5TH GRADE
10.3/ 100
METRIC RATING
209th/ 347
METRIC RANK
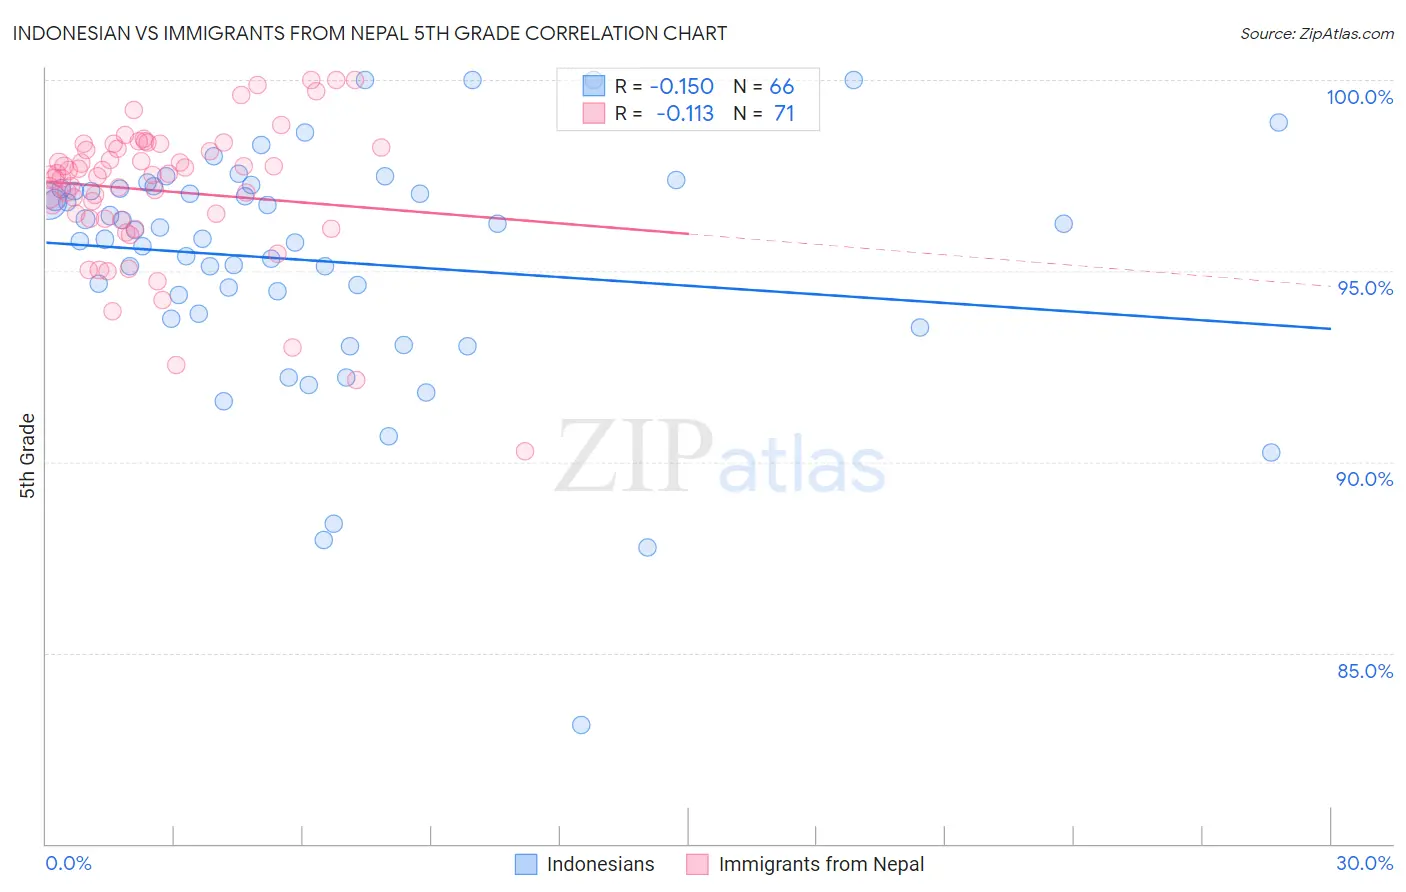
Indonesian vs Immigrants from Nepal 5th Grade Correlation Chart
The statistical analysis conducted on geographies consisting of 162,727,113 people shows a poor negative correlation between the proportion of Indonesians and percentage of population with at least 5th grade education in the United States with a correlation coefficient (R) of -0.150 and weighted average of 96.0%. Similarly, the statistical analysis conducted on geographies consisting of 186,739,570 people shows a poor negative correlation between the proportion of Immigrants from Nepal and percentage of population with at least 5th grade education in the United States with a correlation coefficient (R) of -0.113 and weighted average of 97.1%, a difference of 1.2%.
5th Grade Correlation Summary
| Measurement | Indonesian | Immigrants from Nepal |
| Minimum | 83.1% | 90.3% |
| Maximum | 100.0% | 100.0% |
| Range | 16.9% | 9.7% |
| Mean | 95.3% | 97.1% |
| Median | 96.0% | 97.5% |
| Interquartile 25% (IQ1) | 93.9% | 96.4% |
| Interquartile 75% (IQ3) | 97.1% | 98.2% |
| Interquartile Range (IQR) | 3.3% | 1.9% |
| Standard Deviation (Sample) | 3.1% | 1.8% |
| Standard Deviation (Population) | 3.1% | 1.8% |
Similar Demographics by 5th Grade
Demographics Similar to Indonesians by 5th Grade
In terms of 5th grade, the demographic groups most similar to Indonesians are Immigrants from Bangladesh (96.0%, a difference of 0.020%), Immigrants from Guyana (96.0%, a difference of 0.040%), Ecuadorian (96.0%, a difference of 0.050%), Vietnamese (95.9%, a difference of 0.050%), and Immigrants from Haiti (96.0%, a difference of 0.060%).
| Demographics | Rating | Rank | 5th Grade |
| Puerto Ricans | 0.0 /100 | #303 | Tragic 96.1% |
| Immigrants | Burma/Myanmar | 0.0 /100 | #304 | Tragic 96.1% |
| Immigrants | Laos | 0.0 /100 | #305 | Tragic 96.0% |
| Immigrants | Haiti | 0.0 /100 | #306 | Tragic 96.0% |
| Immigrants | Caribbean | 0.0 /100 | #307 | Tragic 96.0% |
| Ecuadorians | 0.0 /100 | #308 | Tragic 96.0% |
| Immigrants | Guyana | 0.0 /100 | #309 | Tragic 96.0% |
| Indonesians | 0.0 /100 | #310 | Tragic 96.0% |
| Immigrants | Bangladesh | 0.0 /100 | #311 | Tragic 96.0% |
| Vietnamese | 0.0 /100 | #312 | Tragic 95.9% |
| Bangladeshis | 0.0 /100 | #313 | Tragic 95.9% |
| Immigrants | Portugal | 0.0 /100 | #314 | Tragic 95.9% |
| Nicaraguans | 0.0 /100 | #315 | Tragic 95.9% |
| Immigrants | Ecuador | 0.0 /100 | #316 | Tragic 95.8% |
| Belizeans | 0.0 /100 | #317 | Tragic 95.8% |
Demographics Similar to Immigrants from Nepal by 5th Grade
In terms of 5th grade, the demographic groups most similar to Immigrants from Nepal are Immigrants from Oceania (97.1%, a difference of 0.0%), Paiute (97.1%, a difference of 0.010%), Iraqi (97.1%, a difference of 0.010%), Laotian (97.1%, a difference of 0.010%), and Moroccan (97.1%, a difference of 0.020%).
| Demographics | Rating | Rank | 5th Grade |
| Africans | 15.3 /100 | #202 | Poor 97.2% |
| Immigrants | Bahamas | 14.9 /100 | #203 | Poor 97.2% |
| Immigrants | Zaire | 13.7 /100 | #204 | Poor 97.1% |
| Moroccans | 12.0 /100 | #205 | Poor 97.1% |
| Paiute | 11.6 /100 | #206 | Poor 97.1% |
| Iraqis | 10.9 /100 | #207 | Poor 97.1% |
| Laotians | 10.8 /100 | #208 | Poor 97.1% |
| Immigrants | Nepal | 10.3 /100 | #209 | Poor 97.1% |
| Immigrants | Oceania | 10.0 /100 | #210 | Poor 97.1% |
| Samoans | 8.5 /100 | #211 | Tragic 97.1% |
| Immigrants | Iraq | 8.3 /100 | #212 | Tragic 97.1% |
| Portuguese | 7.8 /100 | #213 | Tragic 97.1% |
| Costa Ricans | 7.7 /100 | #214 | Tragic 97.1% |
| Immigrants | Morocco | 7.5 /100 | #215 | Tragic 97.1% |
| Sudanese | 7.0 /100 | #216 | Tragic 97.1% |