Immigrants from Brazil vs Immigrants from Nepal 5th Grade

COMPARE

Immigrants from Brazil
Race
Ancestry
AfghanAfricanAlaska NativeAlaskan AthabascanAlbanianAleutAlsatianAmericanApacheArabArapahoArgentineanArmenianAssyrian/Chaldean/SyriacAustralianAustrianBahamianBangladeshiBarbadianBasqueBelgianBelizeanBermudanBhutaneseBlackfeetBolivianBrazilianBritishBritish West IndianBulgarianBurmeseCajunCambodianCanadianCape VerdeanCarpatho RusynCelticCentral AmericanCentral American IndianCherokeeCheyenneChickasawChileanChineseChippewaChoctawColombianColvilleComancheCosta RicanCreeCreekCroatianCrowCubanCypriotCzechCzechoslovakianDanishDelawareDominicanDutchDutch West IndianEastern EuropeanEcuadorianEgyptianEnglishEstonianEthiopianEuropeanFijianFilipinoFinnishFrenchFrench American IndianFrench CanadianGermanGerman RussianGhanaianGreekGuamanian/ChamorroGuatemalanGuyaneseHaitianHmongHonduranHopiHoumaHungarianIcelanderIndian (Asian)IndonesianInupiatIranianIraqiIrishIroquoisIsraeliItalianJamaicanJapaneseJordanianKenyanKiowaKoreanLaotianLatvianLebaneseLiberianLithuanianLumbeeLuxembourgerMacedonianMalaysianMalteseMarshalleseMenomineeMexicanMexican American IndianMongolianMoroccanNative HawaiianNavajoNepaleseNew ZealanderNicaraguanNigerianNorthern EuropeanNorwegianOkinawanOsageOttawaPaiutePakistaniPalestinianPanamanianParaguayanPennsylvania GermanPeruvianPimaPolishPortuguesePotawatomiPuebloPuerto RicanPuget Sound SalishRomanianRussianSalvadoranSamoanScandinavianScotch-IrishScottishSeminoleSenegaleseSerbianShoshoneSierra LeoneanSiouxSlavicSlovakSloveneSomaliSouth AfricanSouth AmericanSouth American IndianSoviet UnionSpaniardSpanishSpanish AmericanSpanish American IndianSri LankanSubsaharan AfricanSudaneseSwedishSwissSyrianTaiwaneseThaiTlingit-HaidaTohono O'OdhamTonganTrinidadian and TobagonianTsimshianTurkishU.S. Virgin IslanderUgandanUkrainianUruguayanUteVenezuelanVietnameseWelshWest IndianYakamaYaquiYugoslavianYumanYup'ikZimbabwean
Immigration
NonimmigrantsImmigrantsAfghanistanAfricaAlbaniaArgentinaArmeniaAsiaAustraliaAustriaBahamasBangladeshBarbadosBelarusBelgiumBelizeBoliviaBosnia and HerzegovinaBrazilBulgariaBurma/MyanmarCabo VerdeCambodiaCameroonCanadaCaribbeanCentral AmericaChileChinaColombiaCongoCosta RicaCroatiaCubaCzechoslovakiaDenmarkDominicaDominican RepublicEastern AfricaEastern AsiaEastern EuropeEcuadorEgyptEl SalvadorEnglandEritreaEthiopiaEuropeFijiFranceGermanyGhanaGreeceGrenadaGuatemalaGuyanaHaitiHondurasHong KongHungaryIndiaIndonesiaIranIraqIrelandIsraelItalyJamaicaJapanJordanKazakhstanKenyaKoreaKuwaitLaosLatin AmericaLatviaLebanonLiberiaLithuaniaMalaysiaMexicoMicronesiaMiddle AfricaMoldovaMoroccoNetherlandsNicaraguaNigeriaNorth AmericaNorth MacedoniaNorthern AfricaNorthern EuropeNorwayOceaniaPakistanPanamaPeruPhilippinesPolandPortugalRomaniaRussiaSaudi ArabiaScotlandSenegalSerbiaSierra LeoneSingaporeSomaliaSouth AfricaSouth AmericaSouth Central AsiaSouth Eastern AsiaSouthern EuropeSpainSri LankaSt. Vincent and the GrenadinesSudanSwedenSwitzerlandSyriaTaiwanThailandTrinidad and TobagoTurkeyUgandaUkraineUruguayUzbekistanVenezuelaVietnamWest IndiesWestern AfricaWestern AsiaWestern EuropeYemenZaireZimbabweAzores
Immigrants from Nepal
Race
Ancestry
AfghanAfricanAlaska NativeAlaskan AthabascanAlbanianAleutAlsatianAmericanApacheArabArapahoArgentineanArmenianAssyrian/Chaldean/SyriacAustralianAustrianBahamianBangladeshiBarbadianBasqueBelgianBelizeanBermudanBhutaneseBlackfeetBolivianBrazilianBritishBritish West IndianBulgarianBurmeseCajunCambodianCanadianCape VerdeanCarpatho RusynCelticCentral AmericanCentral American IndianCherokeeCheyenneChickasawChileanChineseChippewaChoctawColombianColvilleComancheCosta RicanCreeCreekCroatianCrowCubanCypriotCzechCzechoslovakianDanishDelawareDominicanDutchDutch West IndianEastern EuropeanEcuadorianEgyptianEnglishEstonianEthiopianEuropeanFijianFilipinoFinnishFrenchFrench American IndianFrench CanadianGermanGerman RussianGhanaianGreekGuamanian/ChamorroGuatemalanGuyaneseHaitianHmongHonduranHopiHoumaHungarianIcelanderIndian (Asian)IndonesianInupiatIranianIraqiIrishIroquoisIsraeliItalianJamaicanJapaneseJordanianKenyanKiowaKoreanLaotianLatvianLebaneseLiberianLithuanianLumbeeLuxembourgerMacedonianMalaysianMalteseMarshalleseMenomineeMexicanMexican American IndianMongolianMoroccanNative HawaiianNavajoNepaleseNew ZealanderNicaraguanNigerianNorthern EuropeanNorwegianOkinawanOsageOttawaPaiutePakistaniPalestinianPanamanianParaguayanPennsylvania GermanPeruvianPimaPolishPortuguesePotawatomiPuebloPuerto RicanPuget Sound SalishRomanianRussianSalvadoranSamoanScandinavianScotch-IrishScottishSeminoleSenegaleseSerbianShoshoneSierra LeoneanSiouxSlavicSlovakSloveneSomaliSouth AfricanSouth AmericanSouth American IndianSoviet UnionSpaniardSpanishSpanish AmericanSpanish American IndianSri LankanSubsaharan AfricanSudaneseSwedishSwissSyrianTaiwaneseThaiTlingit-HaidaTohono O'OdhamTonganTrinidadian and TobagonianTsimshianTurkishU.S. Virgin IslanderUgandanUkrainianUruguayanUteVenezuelanVietnameseWelshWest IndianYakamaYaquiYugoslavianYumanYup'ikZimbabwean
Immigration
NonimmigrantsImmigrantsAfghanistanAfricaAlbaniaArgentinaArmeniaAsiaAustraliaAustriaBahamasBangladeshBarbadosBelarusBelgiumBelizeBoliviaBosnia and HerzegovinaBulgariaBurma/MyanmarCabo VerdeCambodiaCameroonCanadaCaribbeanCentral AmericaChileChinaColombiaCongoCosta RicaCroatiaCubaCzechoslovakiaDenmarkDominicaDominican RepublicEastern AfricaEastern AsiaEastern EuropeEcuadorEgyptEl SalvadorEnglandEritreaEthiopiaEuropeFijiFranceGermanyGhanaGreeceGrenadaGuatemalaGuyanaHaitiHondurasHong KongHungaryIndiaIndonesiaIranIraqIrelandIsraelItalyJamaicaJapanJordanKazakhstanKenyaKoreaKuwaitLaosLatin AmericaLatviaLebanonLiberiaLithuaniaMalaysiaMexicoMicronesiaMiddle AfricaMoldovaMoroccoNepalNetherlandsNicaraguaNigeriaNorth AmericaNorth MacedoniaNorthern AfricaNorthern EuropeNorwayOceaniaPakistanPanamaPeruPhilippinesPolandPortugalRomaniaRussiaSaudi ArabiaScotlandSenegalSerbiaSierra LeoneSingaporeSomaliaSouth AfricaSouth AmericaSouth Central AsiaSouth Eastern AsiaSouthern EuropeSpainSri LankaSt. Vincent and the GrenadinesSudanSwedenSwitzerlandSyriaTaiwanThailandTrinidad and TobagoTurkeyUgandaUkraineUruguayUzbekistanVenezuelaVietnamWest IndiesWestern AfricaWestern AsiaWestern EuropeYemenZaireZimbabweAzores
5th Grade
Income
Poverty
Unemployment
Labor Participation
Family Structure
Vehicle Availability
Education Level
Disability

5th Grade Comparison

Immigrants from Brazil

Immigrants from Nepal

Fair
Poor
97.3%
5TH GRADE
31.5/ 100
METRIC RATING
191st/ 347
METRIC RANK
97.1%
5TH GRADE
10.3/ 100
METRIC RATING
209th/ 347
METRIC RANK

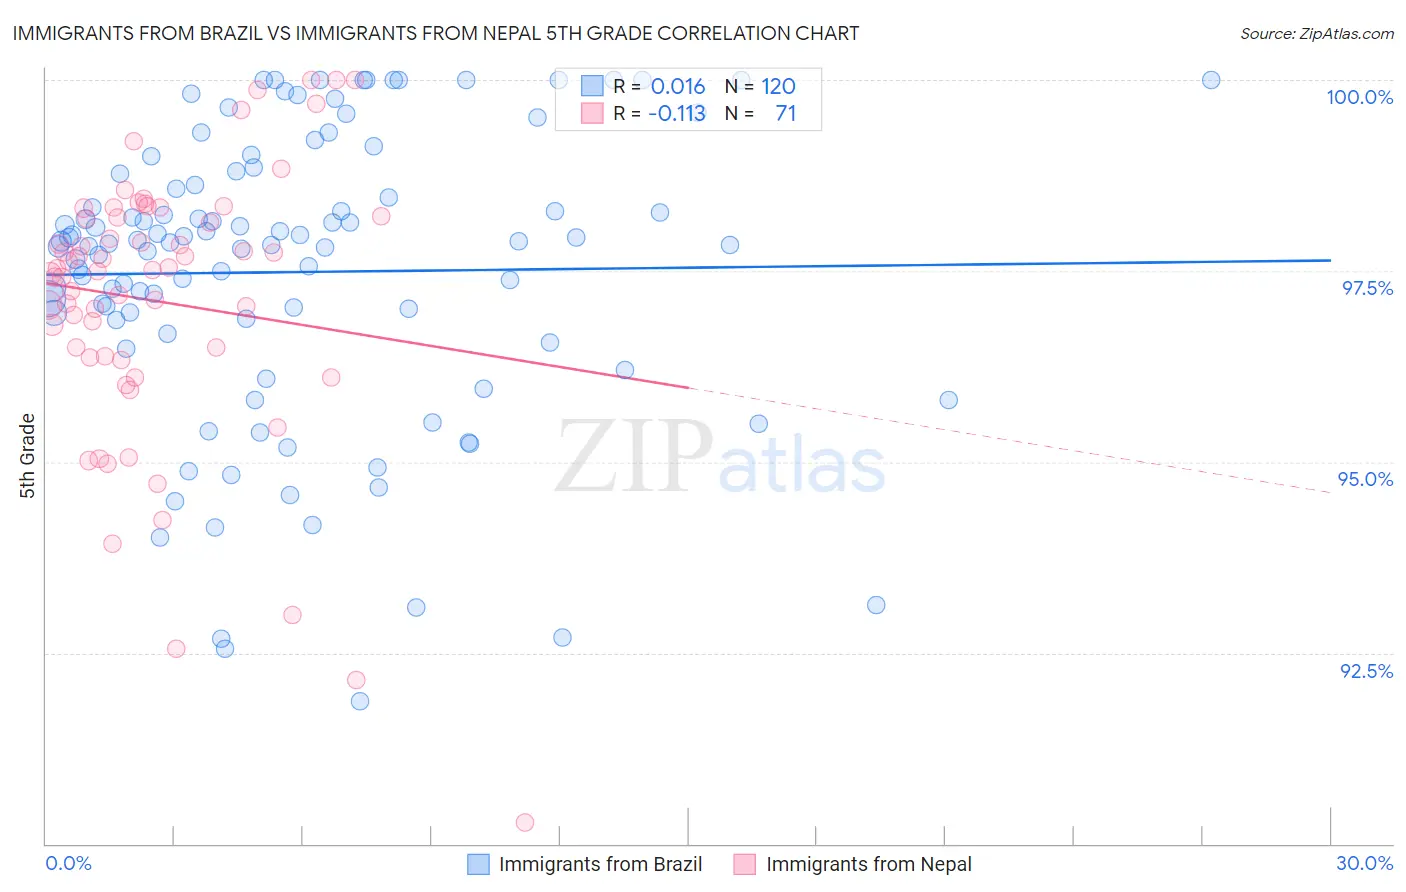
Immigrants from Brazil vs Immigrants from Nepal 5th Grade Correlation Chart

The statistical analysis conducted on geographies consisting of 343,021,580 people shows no correlation between the proportion of Immigrants from Brazil and percentage of population with at least 5th grade education in the United States with a correlation coefficient (R) of 0.016 and weighted average of 97.3%. Similarly, the statistical analysis conducted on geographies consisting of 186,739,570 people shows a poor negative correlation between the proportion of Immigrants from Nepal and percentage of population with at least 5th grade education in the United States with a correlation coefficient (R) of -0.113 and weighted average of 97.1%, a difference of 0.14%.
Immigrants from Brazil vs Immigrants from Nepal 5th Grade

5th Grade Correlation Summary

MeasurementImmigrants from BrazilImmigrants from Nepal
Minimum91.9%90.3%
Maximum100.0%100.0%
Range8.1%9.7%
Mean97.5%97.1%
Median97.9%97.5%
Interquartile 25% (IQ1)96.8%96.4%
Interquartile 75% (IQ3)98.7%98.2%
Interquartile Range (IQR)1.9%1.9%
Standard Deviation (Sample)1.9%1.8%
Standard Deviation (Population)1.9%1.8%

Demographics Similar to Immigrants from Brazil and Immigrants from Nepal by 5th Grade

In terms of 5th grade, the demographic groups most similar to Immigrants from Brazil are Black/African American (97.3%, a difference of 0.0%), Panamanian (97.3%, a difference of 0.0%), Navajo (97.2%, a difference of 0.010%), Immigrants from Albania (97.2%, a difference of 0.010%), and Guamanian/Chamorro (97.2%, a difference of 0.020%). Similarly, the demographic groups most similar to Immigrants from Nepal are Immigrants from Oceania (97.1%, a difference of 0.0%), Paiute (97.1%, a difference of 0.010%), Iraqi (97.1%, a difference of 0.010%), Laotian (97.1%, a difference of 0.010%), and Moroccan (97.1%, a difference of 0.020%).
DemographicsRating | Rank5th Grade
Blacks/African Americans
31.8
/100
|
#190
Fair
97.3%
Immigrants | Brazil
31.5
/100
|
#191
Fair
97.3%
Panamanians
31.3
/100
|
#192
Fair
97.3%
Navajo
29.0
/100
|
#193
Fair
97.2%
Immigrants | Albania
28.5
/100
|
#194
Fair
97.2%
Guamanians/Chamorros
26.8
/100
|
#195
Fair
97.2%
Hawaiians
25.6
/100
|
#196
Fair
97.2%
Brazilians
25.4
/100
|
#197
Fair
97.2%
Immigrants | Uganda
21.1
/100
|
#198
Fair
97.2%
Natives/Alaskans
18.0
/100
|
#199
Poor
97.2%
Immigrants | Northern Africa
16.8
/100
|
#200
Poor
97.2%
Immigrants | Chile
16.6
/100
|
#201
Poor
97.2%
Africans
15.3
/100
|
#202
Poor
97.2%
Immigrants | Bahamas
14.9
/100
|
#203
Poor
97.2%
Immigrants | Zaire
13.7
/100
|
#204
Poor
97.1%
Moroccans
12.0
/100
|
#205
Poor
97.1%
Paiute
11.6
/100
|
#206
Poor
97.1%
Iraqis
10.9
/100
|
#207
Poor
97.1%
Laotians
10.8
/100
|
#208
Poor
97.1%
Immigrants | Nepal
10.3
/100
|
#209
Poor
97.1%
Immigrants | Oceania
10.0
/100
|
#210
Poor
97.1%