Italian vs Immigrants from Nepal 5th Grade
COMPARE
Italian
Immigrants from Nepal
5th Grade
5th Grade Comparison
Italians
Immigrants from Nepal
98.1%
5TH GRADE
100.0/ 100
METRIC RATING
35th/ 347
METRIC RANK
97.1%
5TH GRADE
10.3/ 100
METRIC RATING
209th/ 347
METRIC RANK
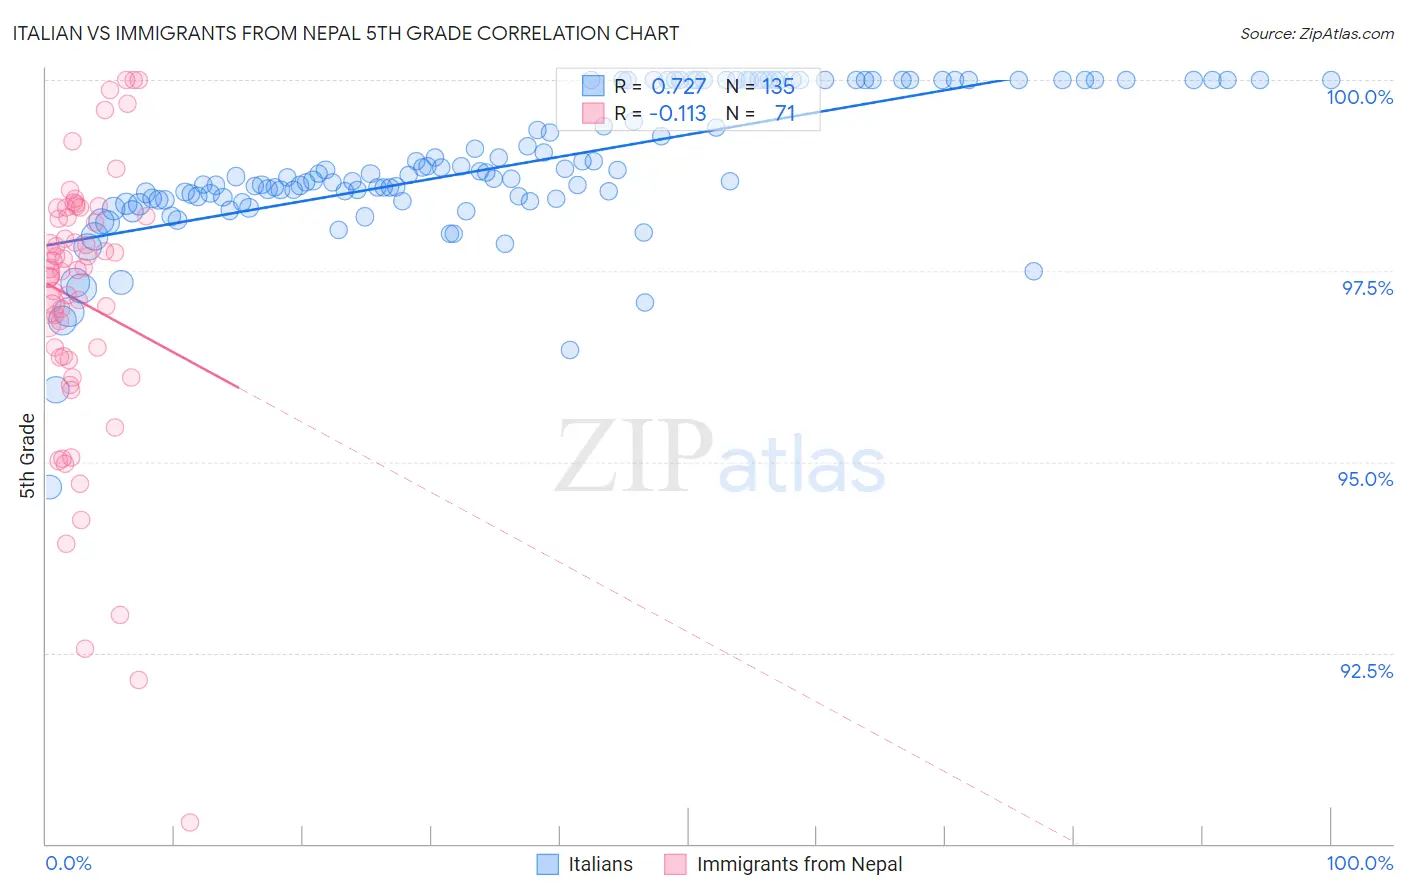
Italian vs Immigrants from Nepal 5th Grade Correlation Chart
The statistical analysis conducted on geographies consisting of 575,115,824 people shows a strong positive correlation between the proportion of Italians and percentage of population with at least 5th grade education in the United States with a correlation coefficient (R) of 0.727 and weighted average of 98.1%. Similarly, the statistical analysis conducted on geographies consisting of 186,739,570 people shows a poor negative correlation between the proportion of Immigrants from Nepal and percentage of population with at least 5th grade education in the United States with a correlation coefficient (R) of -0.113 and weighted average of 97.1%, a difference of 1.0%.
5th Grade Correlation Summary
| Measurement | Italian | Immigrants from Nepal |
| Minimum | 94.7% | 90.3% |
| Maximum | 100.0% | 100.0% |
| Range | 5.3% | 9.7% |
| Mean | 98.9% | 97.1% |
| Median | 98.7% | 97.5% |
| Interquartile 25% (IQ1) | 98.4% | 96.4% |
| Interquartile 75% (IQ3) | 100.0% | 98.2% |
| Interquartile Range (IQR) | 1.6% | 1.9% |
| Standard Deviation (Sample) | 0.94% | 1.8% |
| Standard Deviation (Population) | 0.94% | 1.8% |
Similar Demographics by 5th Grade
Demographics Similar to Italians by 5th Grade
In terms of 5th grade, the demographic groups most similar to Italians are Swiss (98.1%, a difference of 0.010%), Chinese (98.1%, a difference of 0.010%), British (98.1%, a difference of 0.010%), Chippewa (98.1%, a difference of 0.020%), and Latvian (98.1%, a difference of 0.030%).
| Demographics | Rating | Rank | 5th Grade |
| Czechs | 100.0 /100 | #28 | Exceptional 98.2% |
| Scandinavians | 100.0 /100 | #29 | Exceptional 98.2% |
| French Canadians | 100.0 /100 | #30 | Exceptional 98.2% |
| Europeans | 100.0 /100 | #31 | Exceptional 98.2% |
| Chippewa | 100.0 /100 | #32 | Exceptional 98.1% |
| Swiss | 100.0 /100 | #33 | Exceptional 98.1% |
| Chinese | 100.0 /100 | #34 | Exceptional 98.1% |
| Italians | 100.0 /100 | #35 | Exceptional 98.1% |
| British | 100.0 /100 | #36 | Exceptional 98.1% |
| Latvians | 99.9 /100 | #37 | Exceptional 98.1% |
| Belgians | 99.9 /100 | #38 | Exceptional 98.1% |
| Luxembourgers | 99.9 /100 | #39 | Exceptional 98.1% |
| Eastern Europeans | 99.9 /100 | #40 | Exceptional 98.1% |
| Hungarians | 99.9 /100 | #41 | Exceptional 98.0% |
| Northern Europeans | 99.9 /100 | #42 | Exceptional 98.0% |
Demographics Similar to Immigrants from Nepal by 5th Grade
In terms of 5th grade, the demographic groups most similar to Immigrants from Nepal are Immigrants from Oceania (97.1%, a difference of 0.0%), Paiute (97.1%, a difference of 0.010%), Iraqi (97.1%, a difference of 0.010%), Laotian (97.1%, a difference of 0.010%), and Moroccan (97.1%, a difference of 0.020%).
| Demographics | Rating | Rank | 5th Grade |
| Africans | 15.3 /100 | #202 | Poor 97.2% |
| Immigrants | Bahamas | 14.9 /100 | #203 | Poor 97.2% |
| Immigrants | Zaire | 13.7 /100 | #204 | Poor 97.1% |
| Moroccans | 12.0 /100 | #205 | Poor 97.1% |
| Paiute | 11.6 /100 | #206 | Poor 97.1% |
| Iraqis | 10.9 /100 | #207 | Poor 97.1% |
| Laotians | 10.8 /100 | #208 | Poor 97.1% |
| Immigrants | Nepal | 10.3 /100 | #209 | Poor 97.1% |
| Immigrants | Oceania | 10.0 /100 | #210 | Poor 97.1% |
| Samoans | 8.5 /100 | #211 | Tragic 97.1% |
| Immigrants | Iraq | 8.3 /100 | #212 | Tragic 97.1% |
| Portuguese | 7.8 /100 | #213 | Tragic 97.1% |
| Costa Ricans | 7.7 /100 | #214 | Tragic 97.1% |
| Immigrants | Morocco | 7.5 /100 | #215 | Tragic 97.1% |
| Sudanese | 7.0 /100 | #216 | Tragic 97.1% |