Choctaw vs Immigrants from Bolivia Bachelor's Degree
COMPARE
Choctaw
Immigrants from Bolivia
Bachelor's Degree
Bachelor's Degree Comparison
Choctaw
Immigrants from Bolivia
29.4%
BACHELOR'S DEGREE
0.0/ 100
METRIC RATING
311th/ 347
METRIC RANK
44.2%
BACHELOR'S DEGREE
99.9/ 100
METRIC RATING
55th/ 347
METRIC RANK
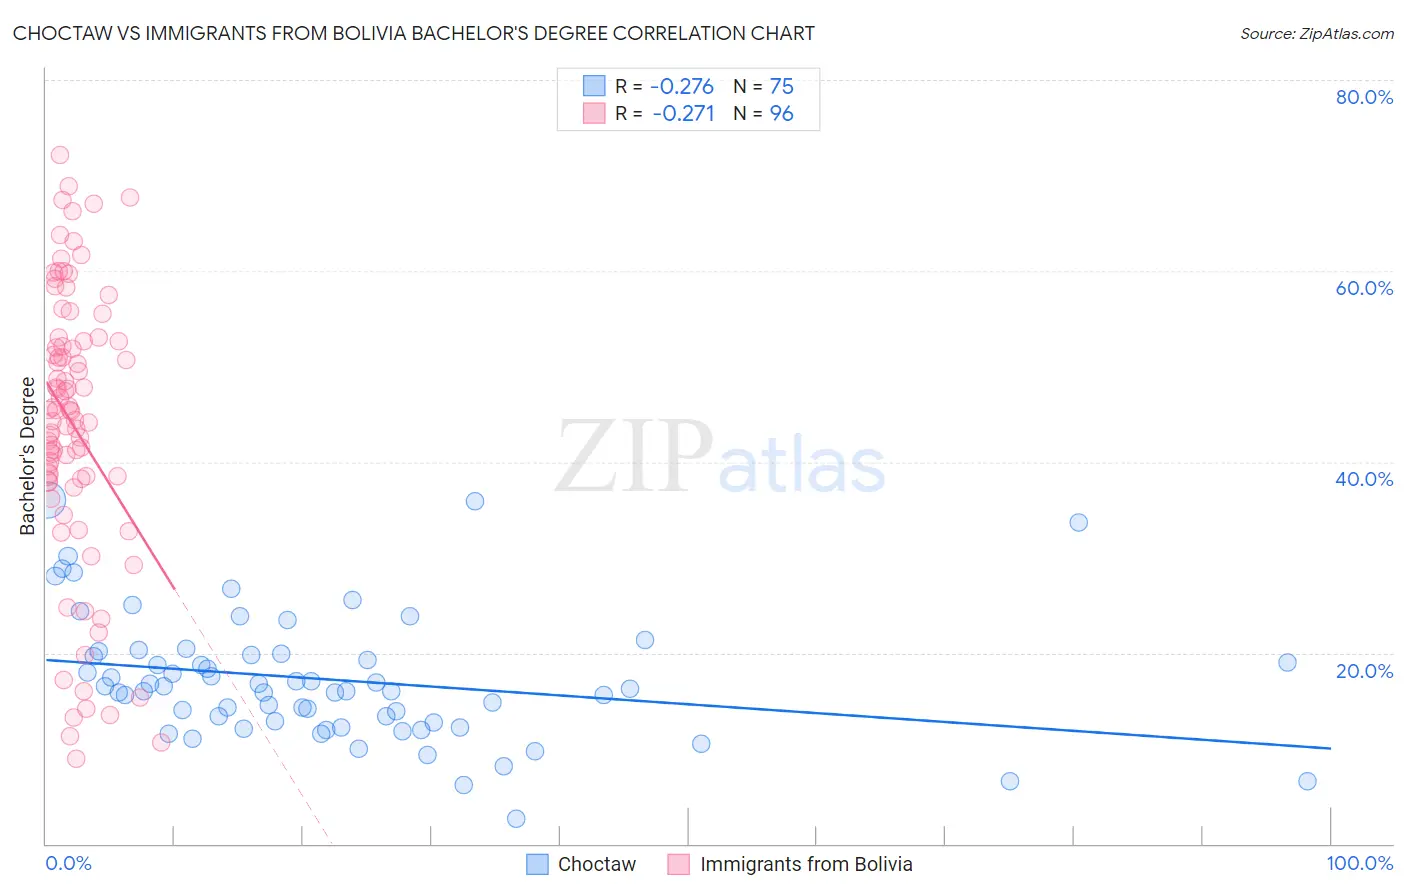
Choctaw vs Immigrants from Bolivia Bachelor's Degree Correlation Chart
The statistical analysis conducted on geographies consisting of 269,719,391 people shows a weak negative correlation between the proportion of Choctaw and percentage of population with at least bachelor's degree education in the United States with a correlation coefficient (R) of -0.276 and weighted average of 29.4%. Similarly, the statistical analysis conducted on geographies consisting of 158,728,335 people shows a weak negative correlation between the proportion of Immigrants from Bolivia and percentage of population with at least bachelor's degree education in the United States with a correlation coefficient (R) of -0.271 and weighted average of 44.2%, a difference of 50.2%.
Bachelor's Degree Correlation Summary
| Measurement | Choctaw | Immigrants from Bolivia |
| Minimum | 2.7% | 8.9% |
| Maximum | 35.9% | 72.2% |
| Range | 33.3% | 63.3% |
| Mean | 17.2% | 43.8% |
| Median | 16.3% | 45.3% |
| Interquartile 25% (IQ1) | 12.8% | 38.1% |
| Interquartile 75% (IQ3) | 20.0% | 52.6% |
| Interquartile Range (IQR) | 7.2% | 14.6% |
| Standard Deviation (Sample) | 6.6% | 14.6% |
| Standard Deviation (Population) | 6.6% | 14.5% |
Similar Demographics by Bachelor's Degree
Demographics Similar to Choctaw by Bachelor's Degree
In terms of bachelor's degree, the demographic groups most similar to Choctaw are Seminole (29.4%, a difference of 0.060%), Cheyenne (29.4%, a difference of 0.070%), Alaska Native (29.4%, a difference of 0.24%), Shoshone (29.3%, a difference of 0.53%), and Hispanic or Latino (29.6%, a difference of 0.54%).
| Demographics | Rating | Rank | Bachelor's Degree |
| Cherokee | 0.0 /100 | #304 | Tragic 30.2% |
| Immigrants | Latin America | 0.0 /100 | #305 | Tragic 30.1% |
| Immigrants | Yemen | 0.0 /100 | #306 | Tragic 29.9% |
| Nepalese | 0.0 /100 | #307 | Tragic 29.9% |
| Cajuns | 0.0 /100 | #308 | Tragic 29.6% |
| Hispanics or Latinos | 0.0 /100 | #309 | Tragic 29.6% |
| Cheyenne | 0.0 /100 | #310 | Tragic 29.4% |
| Choctaw | 0.0 /100 | #311 | Tragic 29.4% |
| Seminole | 0.0 /100 | #312 | Tragic 29.4% |
| Alaska Natives | 0.0 /100 | #313 | Tragic 29.4% |
| Shoshone | 0.0 /100 | #314 | Tragic 29.3% |
| Immigrants | Cabo Verde | 0.0 /100 | #315 | Tragic 29.2% |
| Sioux | 0.0 /100 | #316 | Tragic 29.1% |
| Colville | 0.0 /100 | #317 | Tragic 29.0% |
| Yaqui | 0.0 /100 | #318 | Tragic 29.0% |
Demographics Similar to Immigrants from Bolivia by Bachelor's Degree
In terms of bachelor's degree, the demographic groups most similar to Immigrants from Bolivia are Immigrants from Austria (44.2%, a difference of 0.0%), Immigrants from Serbia (44.1%, a difference of 0.18%), Immigrants from Asia (44.3%, a difference of 0.19%), Immigrants from Spain (44.3%, a difference of 0.25%), and Paraguayan (44.0%, a difference of 0.37%).
| Demographics | Rating | Rank | Bachelor's Degree |
| Estonians | 99.9 /100 | #48 | Exceptional 44.6% |
| Immigrants | Norway | 99.9 /100 | #49 | Exceptional 44.5% |
| Immigrants | Greece | 99.9 /100 | #50 | Exceptional 44.5% |
| Asians | 99.9 /100 | #51 | Exceptional 44.4% |
| Immigrants | Spain | 99.9 /100 | #52 | Exceptional 44.3% |
| Immigrants | Asia | 99.9 /100 | #53 | Exceptional 44.3% |
| Immigrants | Austria | 99.9 /100 | #54 | Exceptional 44.2% |
| Immigrants | Bolivia | 99.9 /100 | #55 | Exceptional 44.2% |
| Immigrants | Serbia | 99.9 /100 | #56 | Exceptional 44.1% |
| Paraguayans | 99.9 /100 | #57 | Exceptional 44.0% |
| Immigrants | Czechoslovakia | 99.9 /100 | #58 | Exceptional 44.0% |
| Australians | 99.9 /100 | #59 | Exceptional 44.0% |
| New Zealanders | 99.9 /100 | #60 | Exceptional 44.0% |
| South Africans | 99.8 /100 | #61 | Exceptional 43.6% |
| Immigrants | Kazakhstan | 99.8 /100 | #62 | Exceptional 43.4% |