French American Indian vs Immigrants from Belarus College, Under 1 year
COMPARE
French American Indian
Immigrants from Belarus
College, Under 1 year
College, Under 1 year Comparison
French American Indians
Immigrants from Belarus
62.4%
COLLEGE, UNDER 1 YEAR
1.5/ 100
METRIC RATING
238th/ 347
METRIC RANK
69.2%
COLLEGE, UNDER 1 YEAR
99.5/ 100
METRIC RATING
62nd/ 347
METRIC RANK
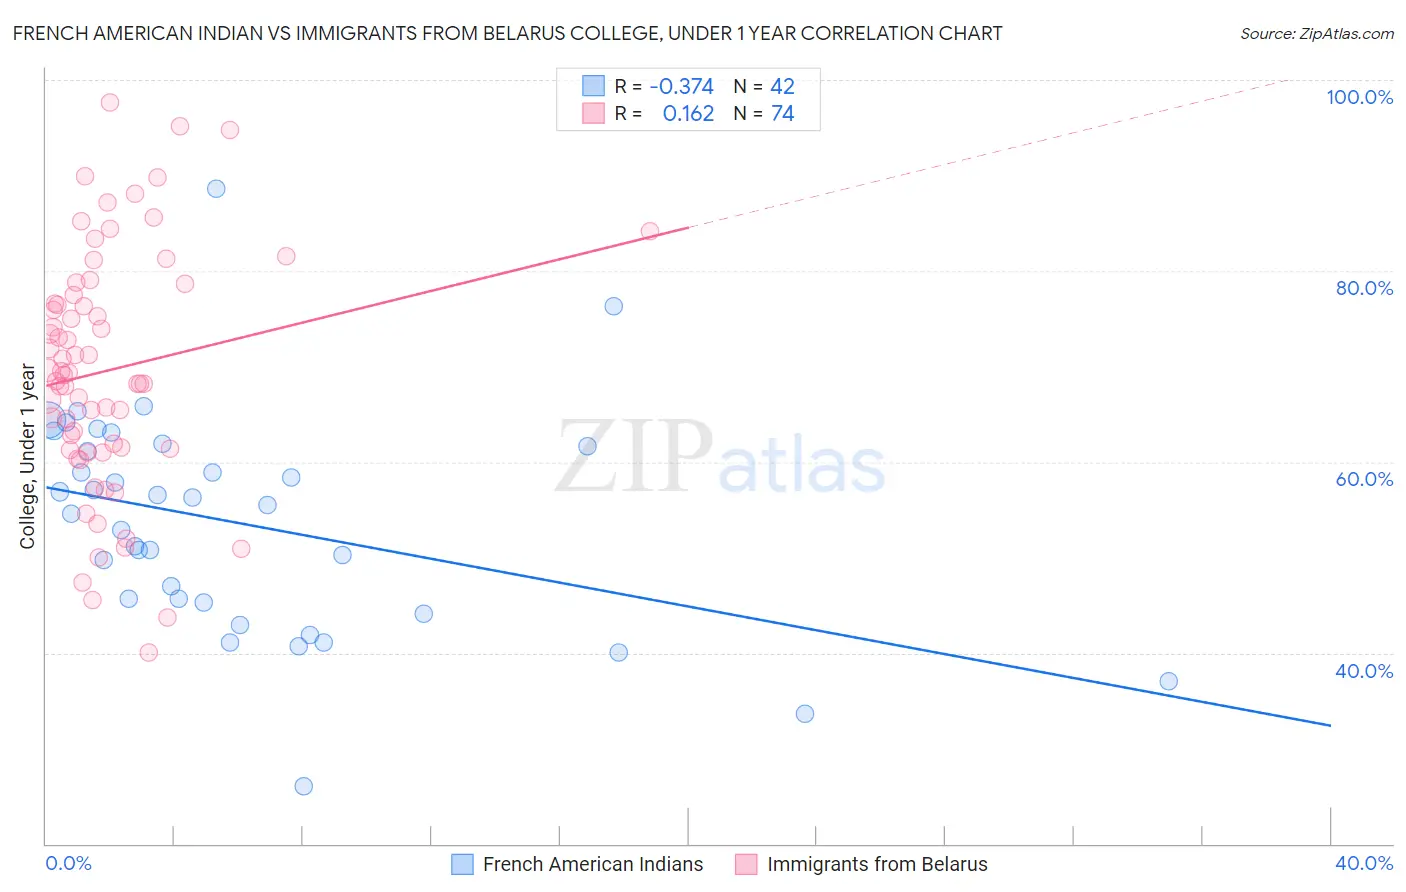
French American Indian vs Immigrants from Belarus College, Under 1 year Correlation Chart
The statistical analysis conducted on geographies consisting of 131,976,089 people shows a mild negative correlation between the proportion of French American Indians and percentage of population with at least college, under 1 year education in the United States with a correlation coefficient (R) of -0.374 and weighted average of 62.4%. Similarly, the statistical analysis conducted on geographies consisting of 150,205,158 people shows a poor positive correlation between the proportion of Immigrants from Belarus and percentage of population with at least college, under 1 year education in the United States with a correlation coefficient (R) of 0.162 and weighted average of 69.2%, a difference of 10.8%.
College, Under 1 year Correlation Summary
| Measurement | French American Indian | Immigrants from Belarus |
| Minimum | 26.1% | 40.0% |
| Maximum | 88.6% | 97.7% |
| Range | 62.5% | 57.6% |
| Mean | 53.5% | 69.6% |
| Median | 55.0% | 69.2% |
| Interquartile 25% (IQ1) | 45.3% | 61.3% |
| Interquartile 75% (IQ3) | 61.6% | 77.5% |
| Interquartile Range (IQR) | 16.3% | 16.2% |
| Standard Deviation (Sample) | 11.7% | 12.6% |
| Standard Deviation (Population) | 11.5% | 12.5% |
Similar Demographics by College, Under 1 year
Demographics Similar to French American Indians by College, Under 1 year
In terms of college, under 1 year, the demographic groups most similar to French American Indians are Immigrants from Burma/Myanmar (62.5%, a difference of 0.090%), Immigrants (62.5%, a difference of 0.12%), Spanish American (62.6%, a difference of 0.25%), Chippewa (62.6%, a difference of 0.30%), and Iroquois (62.6%, a difference of 0.33%).
| Demographics | Rating | Rank | College, Under 1 year |
| Immigrants | Western Africa | 2.4 /100 | #231 | Tragic 62.8% |
| Osage | 2.2 /100 | #232 | Tragic 62.7% |
| Iroquois | 2.0 /100 | #233 | Tragic 62.6% |
| Chippewa | 2.0 /100 | #234 | Tragic 62.6% |
| Spanish Americans | 1.9 /100 | #235 | Tragic 62.6% |
| Immigrants | Immigrants | 1.7 /100 | #236 | Tragic 62.5% |
| Immigrants | Burma/Myanmar | 1.6 /100 | #237 | Tragic 62.5% |
| French American Indians | 1.5 /100 | #238 | Tragic 62.4% |
| Nepalese | 1.1 /100 | #239 | Tragic 62.2% |
| Aleuts | 1.1 /100 | #240 | Tragic 62.2% |
| Ottawa | 1.1 /100 | #241 | Tragic 62.2% |
| Malaysians | 1.1 /100 | #242 | Tragic 62.2% |
| Hawaiians | 1.1 /100 | #243 | Tragic 62.1% |
| Colville | 1.0 /100 | #244 | Tragic 62.1% |
| Delaware | 0.9 /100 | #245 | Tragic 62.1% |
Demographics Similar to Immigrants from Belarus by College, Under 1 year
In terms of college, under 1 year, the demographic groups most similar to Immigrants from Belarus are Immigrants from Kazakhstan (69.2%, a difference of 0.0%), Immigrants from Asia (69.2%, a difference of 0.040%), Immigrants from Serbia (69.3%, a difference of 0.13%), Immigrants from Canada (69.1%, a difference of 0.13%), and Northern European (69.0%, a difference of 0.17%).
| Demographics | Rating | Rank | College, Under 1 year |
| Maltese | 99.7 /100 | #55 | Exceptional 69.5% |
| Immigrants | Scotland | 99.6 /100 | #56 | Exceptional 69.4% |
| Asians | 99.6 /100 | #57 | Exceptional 69.4% |
| Immigrants | Malaysia | 99.6 /100 | #58 | Exceptional 69.3% |
| Immigrants | Serbia | 99.5 /100 | #59 | Exceptional 69.3% |
| Immigrants | Asia | 99.5 /100 | #60 | Exceptional 69.2% |
| Immigrants | Kazakhstan | 99.5 /100 | #61 | Exceptional 69.2% |
| Immigrants | Belarus | 99.5 /100 | #62 | Exceptional 69.2% |
| Immigrants | Canada | 99.4 /100 | #63 | Exceptional 69.1% |
| Northern Europeans | 99.4 /100 | #64 | Exceptional 69.0% |
| Immigrants | Moldova | 99.3 /100 | #65 | Exceptional 69.0% |
| Immigrants | North America | 99.3 /100 | #66 | Exceptional 69.0% |
| Immigrants | Zimbabwe | 99.2 /100 | #67 | Exceptional 68.9% |
| Immigrants | Indonesia | 99.2 /100 | #68 | Exceptional 68.9% |
| Immigrants | Romania | 99.2 /100 | #69 | Exceptional 68.9% |