Indian (Asian) vs Portuguese Female Disability
COMPARE
Indian (Asian)
Portuguese
Female Disability
Female Disability Comparison
Indians (Asian)
Portuguese
10.8%
FEMALE DISABILITY
100.0/ 100
METRIC RATING
17th/ 347
METRIC RANK
13.0%
FEMALE DISABILITY
0.1/ 100
METRIC RATING
274th/ 347
METRIC RANK
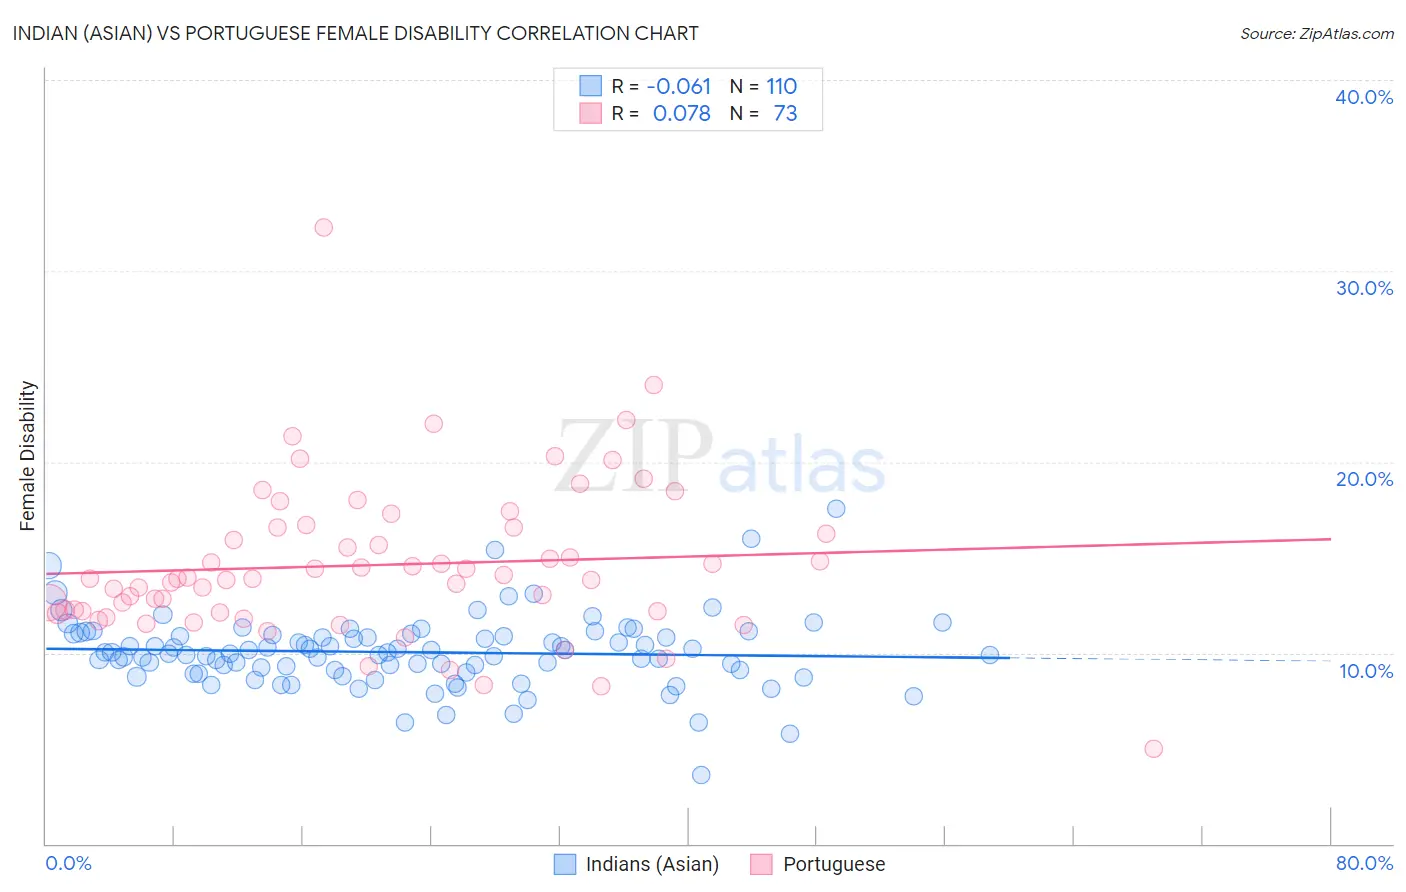
Indian (Asian) vs Portuguese Female Disability Correlation Chart
The statistical analysis conducted on geographies consisting of 495,223,198 people shows a slight negative correlation between the proportion of Indians (Asian) and percentage of females with a disability in the United States with a correlation coefficient (R) of -0.061 and weighted average of 10.8%. Similarly, the statistical analysis conducted on geographies consisting of 450,255,075 people shows a slight positive correlation between the proportion of Portuguese and percentage of females with a disability in the United States with a correlation coefficient (R) of 0.078 and weighted average of 13.0%, a difference of 20.1%.
Female Disability Correlation Summary
| Measurement | Indian (Asian) | Portuguese |
| Minimum | 3.6% | 5.0% |
| Maximum | 17.5% | 32.3% |
| Range | 13.9% | 27.3% |
| Mean | 10.0% | 14.6% |
| Median | 10.0% | 13.9% |
| Interquartile 25% (IQ1) | 9.1% | 12.1% |
| Interquartile 75% (IQ3) | 10.9% | 16.6% |
| Interquartile Range (IQR) | 1.8% | 4.5% |
| Standard Deviation (Sample) | 1.9% | 4.1% |
| Standard Deviation (Population) | 1.9% | 4.1% |
Similar Demographics by Female Disability
Demographics Similar to Indians (Asian) by Female Disability
In terms of female disability, the demographic groups most similar to Indians (Asian) are Okinawan (10.8%, a difference of 0.32%), Immigrants from Iran (10.8%, a difference of 0.38%), Burmese (10.7%, a difference of 0.39%), Immigrants from Venezuela (10.9%, a difference of 0.60%), and Immigrants from Pakistan (10.9%, a difference of 0.77%).
| Demographics | Rating | Rank | Female Disability |
| Immigrants | Hong Kong | 100.0 /100 | #10 | Exceptional 10.6% |
| Immigrants | Korea | 100.0 /100 | #11 | Exceptional 10.6% |
| Immigrants | Israel | 100.0 /100 | #12 | Exceptional 10.7% |
| Immigrants | Eastern Asia | 100.0 /100 | #13 | Exceptional 10.7% |
| Immigrants | China | 100.0 /100 | #14 | Exceptional 10.7% |
| Burmese | 100.0 /100 | #15 | Exceptional 10.7% |
| Okinawans | 100.0 /100 | #16 | Exceptional 10.8% |
| Indians (Asian) | 100.0 /100 | #17 | Exceptional 10.8% |
| Immigrants | Iran | 100.0 /100 | #18 | Exceptional 10.8% |
| Immigrants | Venezuela | 100.0 /100 | #19 | Exceptional 10.9% |
| Immigrants | Pakistan | 100.0 /100 | #20 | Exceptional 10.9% |
| Asians | 100.0 /100 | #21 | Exceptional 10.9% |
| Immigrants | Sri Lanka | 100.0 /100 | #22 | Exceptional 10.9% |
| Venezuelans | 100.0 /100 | #23 | Exceptional 11.0% |
| Immigrants | Argentina | 100.0 /100 | #24 | Exceptional 11.0% |
Demographics Similar to Portuguese by Female Disability
In terms of female disability, the demographic groups most similar to Portuguese are Cheyenne (13.0%, a difference of 0.050%), Immigrants from Dominica (13.0%, a difference of 0.10%), Sioux (12.9%, a difference of 0.12%), German (12.9%, a difference of 0.14%), and Spanish (13.0%, a difference of 0.31%).
| Demographics | Rating | Rank | Female Disability |
| Senegalese | 0.4 /100 | #267 | Tragic 12.8% |
| Immigrants | Laos | 0.4 /100 | #268 | Tragic 12.8% |
| Indonesians | 0.4 /100 | #269 | Tragic 12.8% |
| Immigrants | Liberia | 0.3 /100 | #270 | Tragic 12.9% |
| Dutch | 0.2 /100 | #271 | Tragic 12.9% |
| Germans | 0.1 /100 | #272 | Tragic 12.9% |
| Sioux | 0.1 /100 | #273 | Tragic 12.9% |
| Portuguese | 0.1 /100 | #274 | Tragic 13.0% |
| Cheyenne | 0.1 /100 | #275 | Tragic 13.0% |
| Immigrants | Dominica | 0.1 /100 | #276 | Tragic 13.0% |
| Spanish | 0.1 /100 | #277 | Tragic 13.0% |
| Scottish | 0.1 /100 | #278 | Tragic 13.0% |
| Arapaho | 0.1 /100 | #279 | Tragic 13.0% |
| Irish | 0.1 /100 | #280 | Tragic 13.1% |
| U.S. Virgin Islanders | 0.1 /100 | #281 | Tragic 13.1% |