Uruguayan vs Portuguese High School Diploma
COMPARE
Uruguayan
Portuguese
High School Diploma
High School Diploma Comparison
Uruguayans
Portuguese
88.2%
HIGH SCHOOL DIPLOMA
5.6/ 100
METRIC RATING
226th/ 347
METRIC RANK
88.5%
HIGH SCHOOL DIPLOMA
14.4/ 100
METRIC RATING
208th/ 347
METRIC RANK
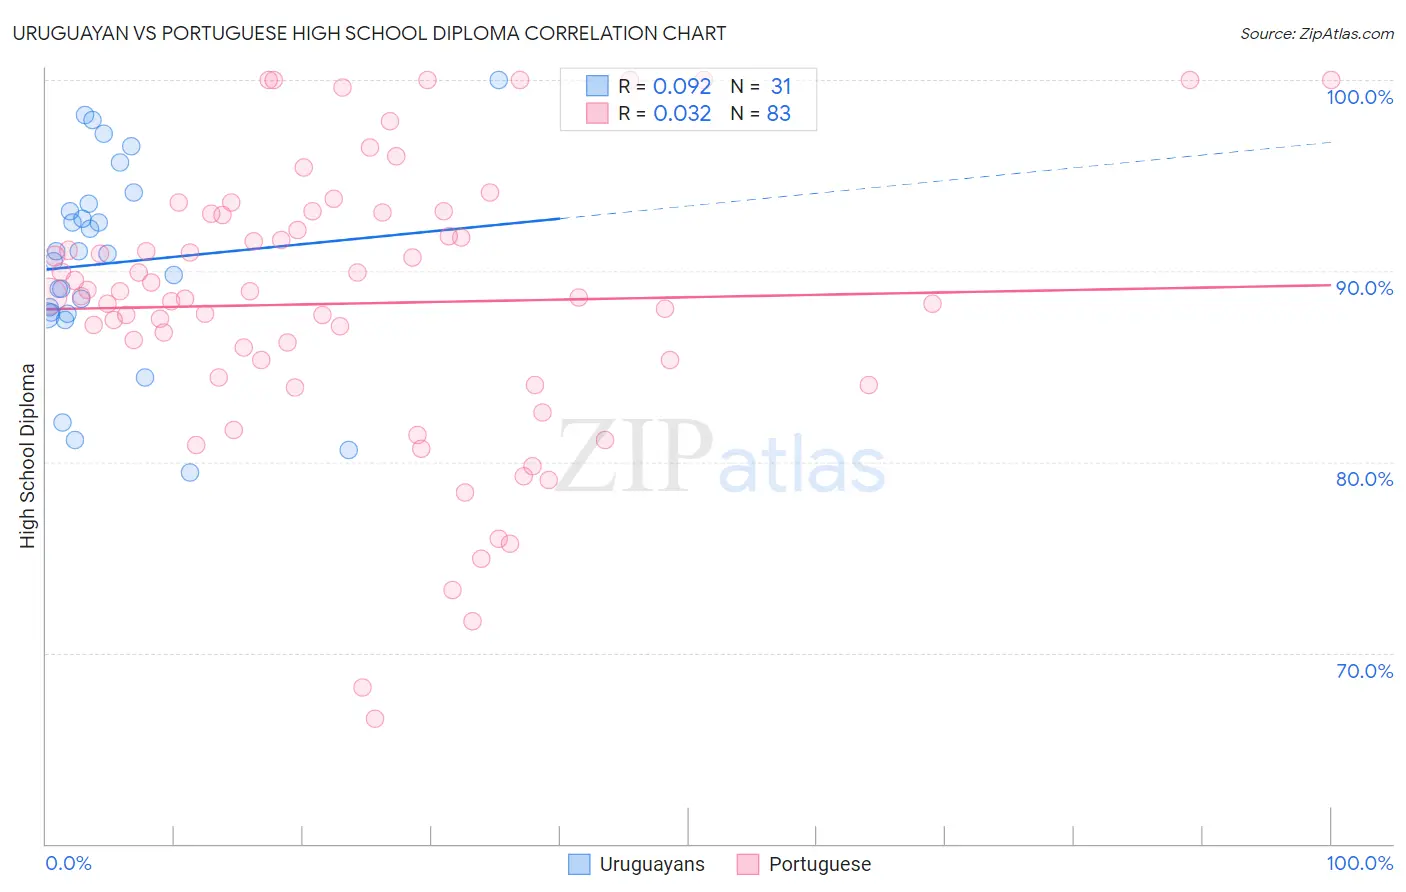
Uruguayan vs Portuguese High School Diploma Correlation Chart
The statistical analysis conducted on geographies consisting of 144,782,615 people shows a slight positive correlation between the proportion of Uruguayans and percentage of population with at least high school diploma education in the United States with a correlation coefficient (R) of 0.092 and weighted average of 88.2%. Similarly, the statistical analysis conducted on geographies consisting of 450,368,110 people shows no correlation between the proportion of Portuguese and percentage of population with at least high school diploma education in the United States with a correlation coefficient (R) of 0.032 and weighted average of 88.5%, a difference of 0.39%.
High School Diploma Correlation Summary
| Measurement | Uruguayan | Portuguese |
| Minimum | 79.4% | 66.5% |
| Maximum | 100.0% | 100.0% |
| Range | 20.6% | 33.5% |
| Mean | 90.4% | 88.3% |
| Median | 90.9% | 88.7% |
| Interquartile 25% (IQ1) | 87.7% | 84.4% |
| Interquartile 75% (IQ3) | 93.5% | 93.0% |
| Interquartile Range (IQR) | 5.8% | 8.5% |
| Standard Deviation (Sample) | 5.2% | 7.4% |
| Standard Deviation (Population) | 5.1% | 7.3% |
Demographics Similar to Uruguayans and Portuguese by High School Diploma
In terms of high school diploma, the demographic groups most similar to Uruguayans are Immigrants from Liberia (88.2%, a difference of 0.010%), Creek (88.3%, a difference of 0.080%), Shoshone (88.3%, a difference of 0.090%), Immigrants from Zaire (88.3%, a difference of 0.12%), and Colville (88.3%, a difference of 0.13%). Similarly, the demographic groups most similar to Portuguese are Cherokee (88.5%, a difference of 0.0%), Samoan (88.5%, a difference of 0.010%), Immigrants from Sierra Leone (88.6%, a difference of 0.040%), Inupiat (88.5%, a difference of 0.040%), and South American Indian (88.5%, a difference of 0.070%).
| Demographics | Rating | Rank | High School Diploma |
| Immigrants | Sierra Leone | 15.8 /100 | #207 | Poor 88.6% |
| Portuguese | 14.4 /100 | #208 | Poor 88.5% |
| Cherokee | 14.3 /100 | #209 | Poor 88.5% |
| Samoans | 14.0 /100 | #210 | Poor 88.5% |
| Inupiat | 13.1 /100 | #211 | Poor 88.5% |
| South American Indians | 12.2 /100 | #212 | Poor 88.5% |
| Immigrants | Somalia | 11.3 /100 | #213 | Poor 88.4% |
| Immigrants | Cameroon | 10.9 /100 | #214 | Poor 88.4% |
| Crow | 10.9 /100 | #215 | Poor 88.4% |
| Chickasaw | 10.7 /100 | #216 | Poor 88.4% |
| Immigrants | Africa | 10.6 /100 | #217 | Poor 88.4% |
| Immigrants | Bolivia | 10.3 /100 | #218 | Poor 88.4% |
| Costa Ricans | 9.6 /100 | #219 | Tragic 88.4% |
| Tongans | 9.5 /100 | #220 | Tragic 88.4% |
| Immigrants | Afghanistan | 8.6 /100 | #221 | Tragic 88.3% |
| Colville | 7.8 /100 | #222 | Tragic 88.3% |
| Immigrants | Zaire | 7.6 /100 | #223 | Tragic 88.3% |
| Shoshone | 7.0 /100 | #224 | Tragic 88.3% |
| Creek | 6.9 /100 | #225 | Tragic 88.3% |
| Uruguayans | 5.6 /100 | #226 | Tragic 88.2% |
| Immigrants | Liberia | 5.5 /100 | #227 | Tragic 88.2% |