Immigrants from Chile vs Portuguese High School Diploma
COMPARE
Immigrants from Chile
Portuguese
High School Diploma
High School Diploma Comparison
Immigrants from Chile
Portuguese
88.9%
HIGH SCHOOL DIPLOMA
31.9/ 100
METRIC RATING
190th/ 347
METRIC RANK
88.5%
HIGH SCHOOL DIPLOMA
14.4/ 100
METRIC RATING
208th/ 347
METRIC RANK
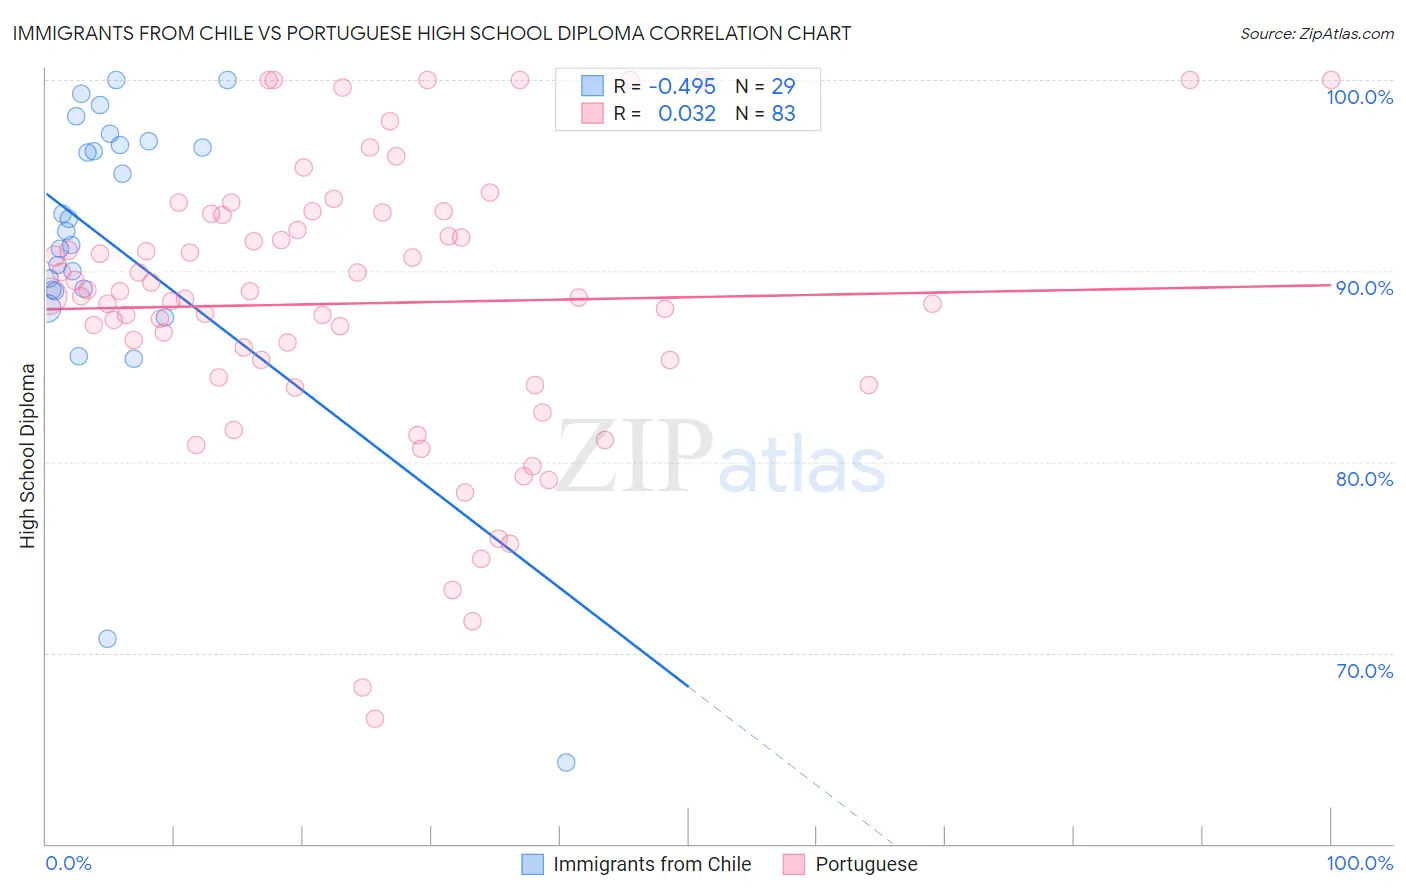
Immigrants from Chile vs Portuguese High School Diploma Correlation Chart
The statistical analysis conducted on geographies consisting of 218,647,266 people shows a moderate negative correlation between the proportion of Immigrants from Chile and percentage of population with at least high school diploma education in the United States with a correlation coefficient (R) of -0.495 and weighted average of 88.9%. Similarly, the statistical analysis conducted on geographies consisting of 450,368,110 people shows no correlation between the proportion of Portuguese and percentage of population with at least high school diploma education in the United States with a correlation coefficient (R) of 0.032 and weighted average of 88.5%, a difference of 0.39%.
High School Diploma Correlation Summary
| Measurement | Immigrants from Chile | Portuguese |
| Minimum | 64.3% | 66.5% |
| Maximum | 100.0% | 100.0% |
| Range | 35.7% | 33.5% |
| Mean | 91.4% | 88.3% |
| Median | 92.1% | 88.7% |
| Interquartile 25% (IQ1) | 89.0% | 84.4% |
| Interquartile 75% (IQ3) | 96.7% | 93.0% |
| Interquartile Range (IQR) | 7.7% | 8.5% |
| Standard Deviation (Sample) | 8.0% | 7.4% |
| Standard Deviation (Population) | 7.8% | 7.3% |
Demographics Similar to Immigrants from Chile and Portuguese by High School Diploma
In terms of high school diploma, the demographic groups most similar to Immigrants from Chile are Immigrants from Uganda (88.9%, a difference of 0.010%), Immigrants from Ethiopia (88.9%, a difference of 0.020%), Moroccan (88.8%, a difference of 0.040%), Immigrants from Oceania (88.8%, a difference of 0.090%), and Immigrants from Venezuela (88.8%, a difference of 0.11%). Similarly, the demographic groups most similar to Portuguese are Cherokee (88.5%, a difference of 0.0%), Immigrants from Sierra Leone (88.6%, a difference of 0.040%), Arapaho (88.6%, a difference of 0.050%), Immigrants from Micronesia (88.6%, a difference of 0.060%), and Armenian (88.6%, a difference of 0.080%).
| Demographics | Rating | Rank | High School Diploma |
| Immigrants | Uganda | 32.6 /100 | #189 | Fair 88.9% |
| Immigrants | Chile | 31.9 /100 | #190 | Fair 88.9% |
| Immigrants | Ethiopia | 30.9 /100 | #191 | Fair 88.9% |
| Moroccans | 29.5 /100 | #192 | Fair 88.8% |
| Immigrants | Oceania | 26.9 /100 | #193 | Fair 88.8% |
| Immigrants | Venezuela | 25.8 /100 | #194 | Fair 88.8% |
| Afghans | 23.9 /100 | #195 | Fair 88.8% |
| Immigrants | Southern Europe | 23.4 /100 | #196 | Fair 88.7% |
| French American Indians | 21.5 /100 | #197 | Fair 88.7% |
| Liberians | 18.8 /100 | #198 | Poor 88.7% |
| Marshallese | 18.7 /100 | #199 | Poor 88.6% |
| Hawaiians | 18.3 /100 | #200 | Poor 88.6% |
| Koreans | 18.1 /100 | #201 | Poor 88.6% |
| Panamanians | 18.0 /100 | #202 | Poor 88.6% |
| Somalis | 17.5 /100 | #203 | Poor 88.6% |
| Armenians | 17.2 /100 | #204 | Poor 88.6% |
| Immigrants | Micronesia | 16.4 /100 | #205 | Poor 88.6% |
| Arapaho | 16.1 /100 | #206 | Poor 88.6% |
| Immigrants | Sierra Leone | 15.8 /100 | #207 | Poor 88.6% |
| Portuguese | 14.4 /100 | #208 | Poor 88.5% |
| Cherokee | 14.3 /100 | #209 | Poor 88.5% |