Subsaharan African vs Immigrants from Afghanistan Bachelor's Degree
COMPARE
Subsaharan African
Immigrants from Afghanistan
Bachelor's Degree
Bachelor's Degree Comparison
Sub-Saharan Africans
Immigrants from Afghanistan
35.8%
BACHELOR'S DEGREE
9.8/ 100
METRIC RATING
218th/ 347
METRIC RANK
39.1%
BACHELOR'S DEGREE
79.7/ 100
METRIC RATING
144th/ 347
METRIC RANK
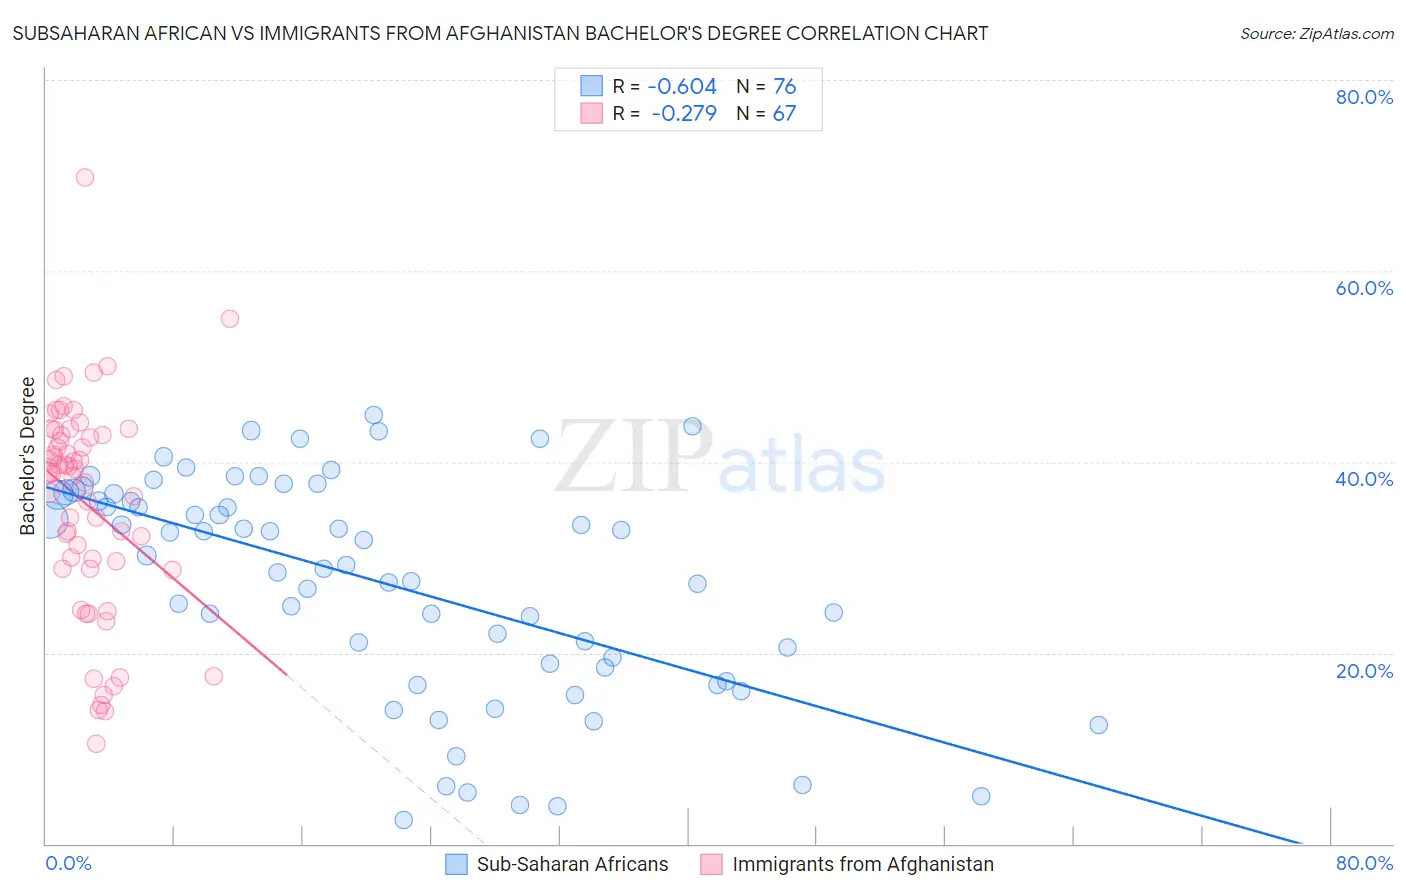
Subsaharan African vs Immigrants from Afghanistan Bachelor's Degree Correlation Chart
The statistical analysis conducted on geographies consisting of 508,116,051 people shows a significant negative correlation between the proportion of Sub-Saharan Africans and percentage of population with at least bachelor's degree education in the United States with a correlation coefficient (R) of -0.604 and weighted average of 35.8%. Similarly, the statistical analysis conducted on geographies consisting of 147,641,942 people shows a weak negative correlation between the proportion of Immigrants from Afghanistan and percentage of population with at least bachelor's degree education in the United States with a correlation coefficient (R) of -0.279 and weighted average of 39.1%, a difference of 9.2%.
Bachelor's Degree Correlation Summary
| Measurement | Subsaharan African | Immigrants from Afghanistan |
| Minimum | 2.6% | 10.5% |
| Maximum | 44.9% | 69.8% |
| Range | 42.3% | 59.3% |
| Mean | 27.3% | 35.6% |
| Median | 29.7% | 38.9% |
| Interquartile 25% (IQ1) | 18.7% | 28.9% |
| Interquartile 75% (IQ3) | 36.6% | 42.9% |
| Interquartile Range (IQR) | 17.9% | 14.0% |
| Standard Deviation (Sample) | 11.5% | 11.2% |
| Standard Deviation (Population) | 11.4% | 11.2% |
Similar Demographics by Bachelor's Degree
Demographics Similar to Sub-Saharan Africans by Bachelor's Degree
In terms of bachelor's degree, the demographic groups most similar to Sub-Saharan Africans are West Indian (35.8%, a difference of 0.030%), Spanish (35.8%, a difference of 0.070%), German Russian (35.8%, a difference of 0.10%), Dutch (35.7%, a difference of 0.18%), and Trinidadian and Tobagonian (35.7%, a difference of 0.32%).
| Demographics | Rating | Rank | Bachelor's Degree |
| Scotch-Irish | 18.3 /100 | #211 | Poor 36.4% |
| Immigrants | Philippines | 17.8 /100 | #212 | Poor 36.4% |
| Immigrants | Panama | 14.2 /100 | #213 | Poor 36.2% |
| Germans | 13.9 /100 | #214 | Poor 36.1% |
| Immigrants | Western Africa | 13.8 /100 | #215 | Poor 36.1% |
| Barbadians | 13.5 /100 | #216 | Poor 36.1% |
| German Russians | 10.2 /100 | #217 | Poor 35.8% |
| Sub-Saharan Africans | 9.8 /100 | #218 | Tragic 35.8% |
| West Indians | 9.7 /100 | #219 | Tragic 35.8% |
| Spanish | 9.6 /100 | #220 | Tragic 35.8% |
| Dutch | 9.2 /100 | #221 | Tragic 35.7% |
| Trinidadians and Tobagonians | 8.8 /100 | #222 | Tragic 35.7% |
| French Canadians | 8.3 /100 | #223 | Tragic 35.6% |
| Immigrants | Barbados | 7.5 /100 | #224 | Tragic 35.5% |
| Immigrants | Burma/Myanmar | 7.3 /100 | #225 | Tragic 35.5% |
Demographics Similar to Immigrants from Afghanistan by Bachelor's Degree
In terms of bachelor's degree, the demographic groups most similar to Immigrants from Afghanistan are Polish (39.1%, a difference of 0.020%), Slovene (39.1%, a difference of 0.030%), Swedish (39.1%, a difference of 0.070%), Immigrants from Sierra Leone (39.0%, a difference of 0.10%), and Iraqi (39.0%, a difference of 0.24%).
| Demographics | Rating | Rank | Bachelor's Degree |
| Icelanders | 86.5 /100 | #137 | Excellent 39.5% |
| Europeans | 85.6 /100 | #138 | Excellent 39.5% |
| Immigrants | Sudan | 84.5 /100 | #139 | Excellent 39.4% |
| Immigrants | Armenia | 84.1 /100 | #140 | Excellent 39.4% |
| South American Indians | 83.6 /100 | #141 | Excellent 39.3% |
| Immigrants | North Macedonia | 81.6 /100 | #142 | Excellent 39.2% |
| Poles | 79.8 /100 | #143 | Good 39.1% |
| Immigrants | Afghanistan | 79.7 /100 | #144 | Good 39.1% |
| Slovenes | 79.5 /100 | #145 | Good 39.1% |
| Swedes | 79.2 /100 | #146 | Good 39.1% |
| Immigrants | Sierra Leone | 79.0 /100 | #147 | Good 39.0% |
| Iraqis | 78.1 /100 | #148 | Good 39.0% |
| Immigrants | Poland | 77.5 /100 | #149 | Good 39.0% |
| South Americans | 77.3 /100 | #150 | Good 38.9% |
| Immigrants | Africa | 76.5 /100 | #151 | Good 38.9% |