Immigrants from West Indies vs Immigrants from Kazakhstan Nursery School
COMPARE
Immigrants from West Indies
Immigrants from Kazakhstan
Nursery School
Nursery School Comparison
Immigrants from West Indies
Immigrants from Kazakhstan
97.4%
NURSERY SCHOOL
0.0/ 100
METRIC RATING
283rd/ 347
METRIC RANK
97.9%
NURSERY SCHOOL
37.1/ 100
METRIC RATING
187th/ 347
METRIC RANK
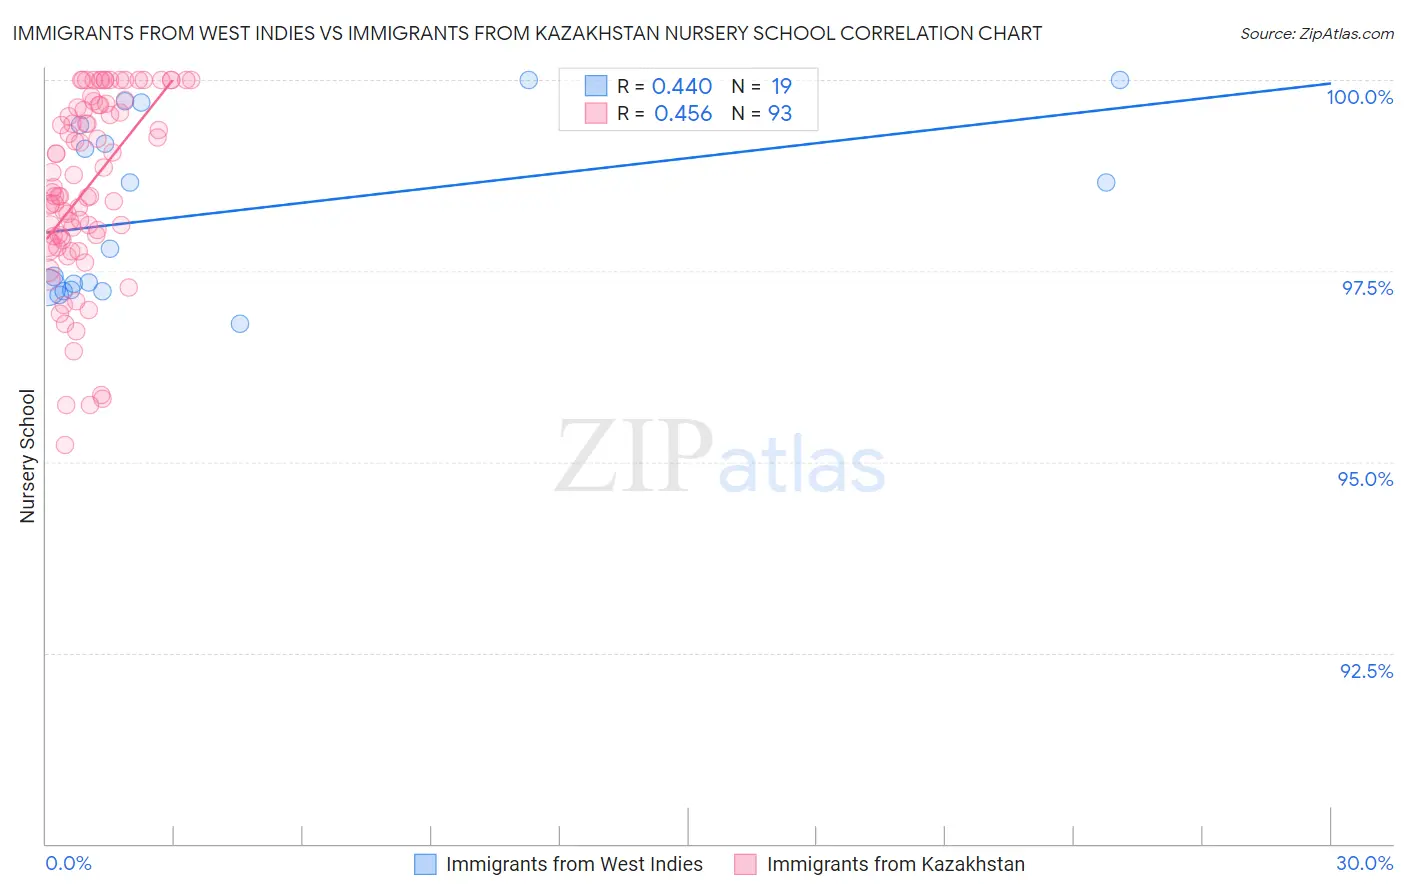
Immigrants from West Indies vs Immigrants from Kazakhstan Nursery School Correlation Chart
The statistical analysis conducted on geographies consisting of 72,457,514 people shows a moderate positive correlation between the proportion of Immigrants from West Indies and percentage of population with at least nursery school education in the United States with a correlation coefficient (R) of 0.440 and weighted average of 97.4%. Similarly, the statistical analysis conducted on geographies consisting of 124,444,388 people shows a moderate positive correlation between the proportion of Immigrants from Kazakhstan and percentage of population with at least nursery school education in the United States with a correlation coefficient (R) of 0.456 and weighted average of 97.9%, a difference of 0.58%.
Nursery School Correlation Summary
| Measurement | Immigrants from West Indies | Immigrants from Kazakhstan |
| Minimum | 96.8% | 95.2% |
| Maximum | 100.0% | 100.0% |
| Range | 3.2% | 4.8% |
| Mean | 98.3% | 98.6% |
| Median | 97.8% | 98.5% |
| Interquartile 25% (IQ1) | 97.2% | 97.9% |
| Interquartile 75% (IQ3) | 99.4% | 99.7% |
| Interquartile Range (IQR) | 2.2% | 1.7% |
| Standard Deviation (Sample) | 1.1% | 1.2% |
| Standard Deviation (Population) | 1.1% | 1.2% |
Similar Demographics by Nursery School
Demographics Similar to Immigrants from West Indies by Nursery School
In terms of nursery school, the demographic groups most similar to Immigrants from West Indies are Immigrants from Trinidad and Tobago (97.4%, a difference of 0.0%), Immigrants from Barbados (97.4%, a difference of 0.020%), Immigrants from Portugal (97.4%, a difference of 0.020%), Immigrants from Hong Kong (97.4%, a difference of 0.030%), and Immigrants from Ghana (97.4%, a difference of 0.040%).
| Demographics | Rating | Rank | Nursery School |
| Immigrants | Philippines | 0.1 /100 | #276 | Tragic 97.5% |
| Immigrants | Western Africa | 0.1 /100 | #277 | Tragic 97.4% |
| Immigrants | Uzbekistan | 0.1 /100 | #278 | Tragic 97.4% |
| Immigrants | Ghana | 0.1 /100 | #279 | Tragic 97.4% |
| Barbadians | 0.0 /100 | #280 | Tragic 97.4% |
| Trinidadians and Tobagonians | 0.0 /100 | #281 | Tragic 97.4% |
| Afghans | 0.0 /100 | #282 | Tragic 97.4% |
| Immigrants | West Indies | 0.0 /100 | #283 | Tragic 97.4% |
| Immigrants | Trinidad and Tobago | 0.0 /100 | #284 | Tragic 97.4% |
| Immigrants | Barbados | 0.0 /100 | #285 | Tragic 97.4% |
| Immigrants | Portugal | 0.0 /100 | #286 | Tragic 97.4% |
| Immigrants | Hong Kong | 0.0 /100 | #287 | Tragic 97.4% |
| Immigrants | Thailand | 0.0 /100 | #288 | Tragic 97.3% |
| Immigrants | St. Vincent and the Grenadines | 0.0 /100 | #289 | Tragic 97.3% |
| Immigrants | Afghanistan | 0.0 /100 | #290 | Tragic 97.3% |
Demographics Similar to Immigrants from Kazakhstan by Nursery School
In terms of nursery school, the demographic groups most similar to Immigrants from Kazakhstan are Portuguese (98.0%, a difference of 0.010%), Immigrants from Poland (98.0%, a difference of 0.010%), Immigrants from Belarus (98.0%, a difference of 0.010%), Immigrants from Argentina (98.0%, a difference of 0.010%), and Arab (97.9%, a difference of 0.010%).
| Demographics | Rating | Rank | Nursery School |
| Immigrants | Bosnia and Herzegovina | 45.6 /100 | #180 | Average 98.0% |
| Egyptians | 42.8 /100 | #181 | Average 98.0% |
| Paiute | 42.0 /100 | #182 | Average 98.0% |
| Portuguese | 41.8 /100 | #183 | Average 98.0% |
| Immigrants | Poland | 41.3 /100 | #184 | Average 98.0% |
| Immigrants | Belarus | 41.0 /100 | #185 | Average 98.0% |
| Immigrants | Argentina | 40.8 /100 | #186 | Average 98.0% |
| Immigrants | Kazakhstan | 37.1 /100 | #187 | Fair 97.9% |
| Arabs | 34.7 /100 | #188 | Fair 97.9% |
| Pakistanis | 34.6 /100 | #189 | Fair 97.9% |
| Panamanians | 34.3 /100 | #190 | Fair 97.9% |
| Immigrants | Taiwan | 30.6 /100 | #191 | Fair 97.9% |
| Blacks/African Americans | 29.4 /100 | #192 | Fair 97.9% |
| Paraguayans | 27.4 /100 | #193 | Fair 97.9% |
| Mongolians | 27.3 /100 | #194 | Fair 97.9% |