Immigrants from Zimbabwe vs Eastern European No Schooling Completed
COMPARE
Immigrants from Zimbabwe
Eastern European
No Schooling Completed
No Schooling Completed Comparison
Immigrants from Zimbabwe
Eastern Europeans
1.9%
NO SCHOOLING COMPLETED
96.2/ 100
METRIC RATING
113th/ 347
METRIC RANK
1.6%
NO SCHOOLING COMPLETED
100.0/ 100
METRIC RATING
35th/ 347
METRIC RANK
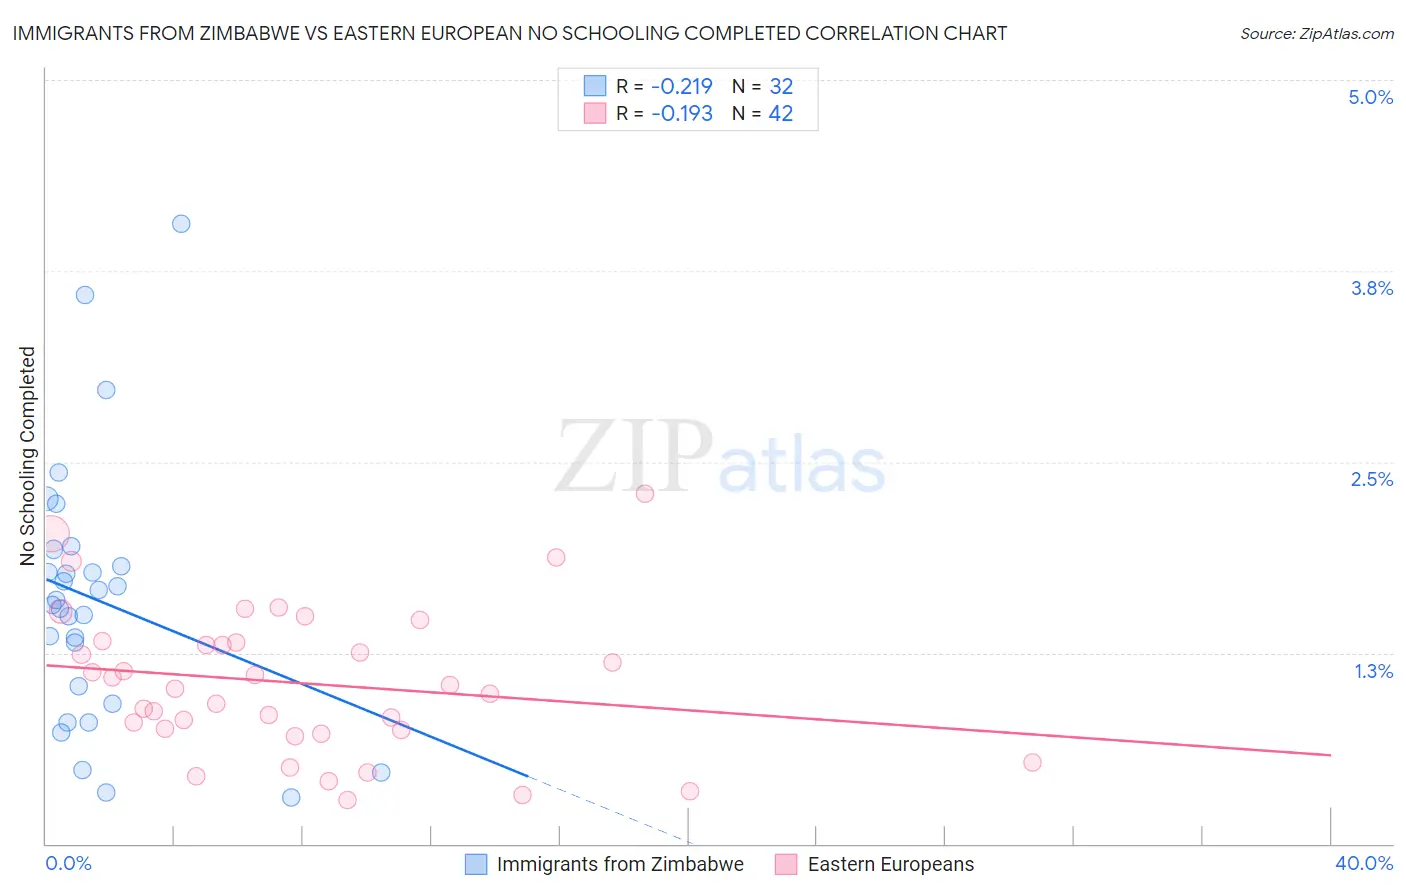
Immigrants from Zimbabwe vs Eastern European No Schooling Completed Correlation Chart
The statistical analysis conducted on geographies consisting of 117,317,666 people shows a weak negative correlation between the proportion of Immigrants from Zimbabwe and percentage of population with no schooling in the United States with a correlation coefficient (R) of -0.219 and weighted average of 1.9%. Similarly, the statistical analysis conducted on geographies consisting of 452,907,345 people shows a poor negative correlation between the proportion of Eastern Europeans and percentage of population with no schooling in the United States with a correlation coefficient (R) of -0.193 and weighted average of 1.6%, a difference of 19.8%.
No Schooling Completed Correlation Summary
| Measurement | Immigrants from Zimbabwe | Eastern European |
| Minimum | 0.31% | 0.29% |
| Maximum | 4.1% | 2.3% |
| Range | 3.8% | 2.0% |
| Mean | 1.6% | 1.1% |
| Median | 1.6% | 1.0% |
| Interquartile 25% (IQ1) | 0.97% | 0.74% |
| Interquartile 75% (IQ3) | 1.9% | 1.3% |
| Interquartile Range (IQR) | 0.90% | 0.57% |
| Standard Deviation (Sample) | 0.86% | 0.48% |
| Standard Deviation (Population) | 0.84% | 0.47% |
Similar Demographics by No Schooling Completed
Demographics Similar to Immigrants from Zimbabwe by No Schooling Completed
In terms of no schooling completed, the demographic groups most similar to Immigrants from Zimbabwe are Immigrants from Norway (1.9%, a difference of 0.010%), Syrian (1.9%, a difference of 0.14%), Lebanese (1.9%, a difference of 0.16%), Pueblo (1.9%, a difference of 0.25%), and Immigrants from Serbia (1.9%, a difference of 0.36%).
| Demographics | Rating | Rank | No Schooling Completed |
| Immigrants | France | 97.3 /100 | #106 | Exceptional 1.8% |
| Yugoslavians | 97.2 /100 | #107 | Exceptional 1.8% |
| Okinawans | 97.1 /100 | #108 | Exceptional 1.8% |
| Immigrants | Saudi Arabia | 96.8 /100 | #109 | Exceptional 1.9% |
| Immigrants | Latvia | 96.7 /100 | #110 | Exceptional 1.9% |
| Immigrants | Japan | 96.6 /100 | #111 | Exceptional 1.9% |
| Pueblo | 96.4 /100 | #112 | Exceptional 1.9% |
| Immigrants | Zimbabwe | 96.2 /100 | #113 | Exceptional 1.9% |
| Immigrants | Norway | 96.1 /100 | #114 | Exceptional 1.9% |
| Syrians | 96.0 /100 | #115 | Exceptional 1.9% |
| Lebanese | 96.0 /100 | #116 | Exceptional 1.9% |
| Immigrants | Serbia | 95.8 /100 | #117 | Exceptional 1.9% |
| Spanish | 95.5 /100 | #118 | Exceptional 1.9% |
| Iroquois | 95.1 /100 | #119 | Exceptional 1.9% |
| Immigrants | Bulgaria | 94.6 /100 | #120 | Exceptional 1.9% |
Demographics Similar to Eastern Europeans by No Schooling Completed
In terms of no schooling completed, the demographic groups most similar to Eastern Europeans are Latvian (1.5%, a difference of 0.95%), Aleut (1.6%, a difference of 1.0%), Italian (1.5%, a difference of 1.2%), Belgian (1.6%, a difference of 1.3%), and Northern European (1.6%, a difference of 1.4%).
| Demographics | Rating | Rank | No Schooling Completed |
| French Canadians | 100.0 /100 | #28 | Exceptional 1.5% |
| Lumbee | 100.0 /100 | #29 | Exceptional 1.5% |
| British | 100.0 /100 | #30 | Exceptional 1.5% |
| Inupiat | 100.0 /100 | #31 | Exceptional 1.5% |
| Swiss | 100.0 /100 | #32 | Exceptional 1.5% |
| Italians | 100.0 /100 | #33 | Exceptional 1.5% |
| Latvians | 100.0 /100 | #34 | Exceptional 1.5% |
| Eastern Europeans | 100.0 /100 | #35 | Exceptional 1.6% |
| Aleuts | 99.9 /100 | #36 | Exceptional 1.6% |
| Belgians | 99.9 /100 | #37 | Exceptional 1.6% |
| Northern Europeans | 99.9 /100 | #38 | Exceptional 1.6% |
| Native Hawaiians | 99.9 /100 | #39 | Exceptional 1.6% |
| Luxembourgers | 99.9 /100 | #40 | Exceptional 1.6% |
| Hungarians | 99.9 /100 | #41 | Exceptional 1.6% |
| Bulgarians | 99.9 /100 | #42 | Exceptional 1.6% |