Immigrants from Zimbabwe vs Bhutanese No Schooling Completed
COMPARE
Immigrants from Zimbabwe
Bhutanese
No Schooling Completed
No Schooling Completed Comparison
Immigrants from Zimbabwe
Bhutanese
1.9%
NO SCHOOLING COMPLETED
96.2/ 100
METRIC RATING
113th/ 347
METRIC RANK
1.8%
NO SCHOOLING COMPLETED
98.4/ 100
METRIC RATING
96th/ 347
METRIC RANK
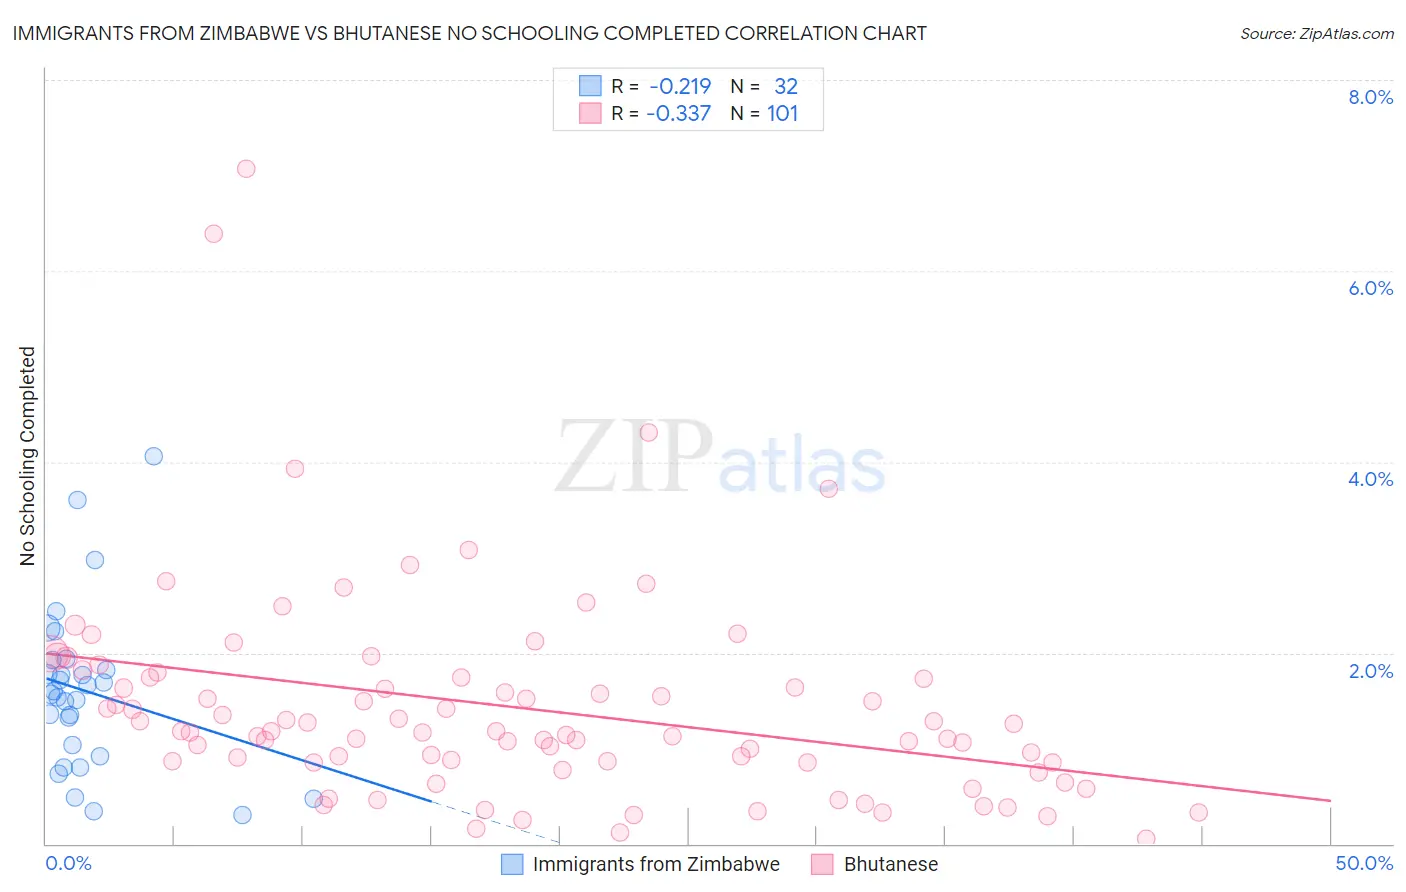
Immigrants from Zimbabwe vs Bhutanese No Schooling Completed Correlation Chart
The statistical analysis conducted on geographies consisting of 117,317,666 people shows a weak negative correlation between the proportion of Immigrants from Zimbabwe and percentage of population with no schooling in the United States with a correlation coefficient (R) of -0.219 and weighted average of 1.9%. Similarly, the statistical analysis conducted on geographies consisting of 448,858,455 people shows a mild negative correlation between the proportion of Bhutanese and percentage of population with no schooling in the United States with a correlation coefficient (R) of -0.337 and weighted average of 1.8%, a difference of 3.6%.
No Schooling Completed Correlation Summary
| Measurement | Immigrants from Zimbabwe | Bhutanese |
| Minimum | 0.31% | 0.048% |
| Maximum | 4.1% | 7.1% |
| Range | 3.8% | 7.0% |
| Mean | 1.6% | 1.4% |
| Median | 1.6% | 1.2% |
| Interquartile 25% (IQ1) | 0.97% | 0.85% |
| Interquartile 75% (IQ3) | 1.9% | 1.7% |
| Interquartile Range (IQR) | 0.90% | 0.89% |
| Standard Deviation (Sample) | 0.86% | 1.1% |
| Standard Deviation (Population) | 0.84% | 1.1% |
Demographics Similar to Immigrants from Zimbabwe and Bhutanese by No Schooling Completed
In terms of no schooling completed, the demographic groups most similar to Immigrants from Zimbabwe are Immigrants from Norway (1.9%, a difference of 0.010%), Pueblo (1.9%, a difference of 0.25%), Immigrants from Japan (1.9%, a difference of 0.43%), Immigrants from Latvia (1.9%, a difference of 0.58%), and Immigrants from Saudi Arabia (1.9%, a difference of 0.72%). Similarly, the demographic groups most similar to Bhutanese are Immigrants from Ireland (1.8%, a difference of 0.18%), Puget Sound Salish (1.8%, a difference of 0.23%), Nonimmigrants (1.8%, a difference of 0.24%), Iranian (1.8%, a difference of 0.46%), and Choctaw (1.8%, a difference of 0.65%).
| Demographics | Rating | Rank | No Schooling Completed |
| Immigrants | Nonimmigrants | 98.5 /100 | #94 | Exceptional 1.8% |
| Puget Sound Salish | 98.5 /100 | #95 | Exceptional 1.8% |
| Bhutanese | 98.4 /100 | #96 | Exceptional 1.8% |
| Immigrants | Ireland | 98.4 /100 | #97 | Exceptional 1.8% |
| Iranians | 98.2 /100 | #98 | Exceptional 1.8% |
| Choctaw | 98.1 /100 | #99 | Exceptional 1.8% |
| Immigrants | Singapore | 98.0 /100 | #100 | Exceptional 1.8% |
| Immigrants | Czechoslovakia | 97.9 /100 | #101 | Exceptional 1.8% |
| Immigrants | Switzerland | 97.9 /100 | #102 | Exceptional 1.8% |
| Basques | 97.9 /100 | #103 | Exceptional 1.8% |
| Thais | 97.5 /100 | #104 | Exceptional 1.8% |
| German Russians | 97.5 /100 | #105 | Exceptional 1.8% |
| Immigrants | France | 97.3 /100 | #106 | Exceptional 1.8% |
| Yugoslavians | 97.2 /100 | #107 | Exceptional 1.8% |
| Okinawans | 97.1 /100 | #108 | Exceptional 1.8% |
| Immigrants | Saudi Arabia | 96.8 /100 | #109 | Exceptional 1.9% |
| Immigrants | Latvia | 96.7 /100 | #110 | Exceptional 1.9% |
| Immigrants | Japan | 96.6 /100 | #111 | Exceptional 1.9% |
| Pueblo | 96.4 /100 | #112 | Exceptional 1.9% |
| Immigrants | Zimbabwe | 96.2 /100 | #113 | Exceptional 1.9% |
| Immigrants | Norway | 96.1 /100 | #114 | Exceptional 1.9% |