Immigrants from Zimbabwe vs Eastern European Average Family Size
COMPARE
Immigrants from Zimbabwe
Eastern European
Average Family Size
Average Family Size Comparison
Immigrants from Zimbabwe
Eastern Europeans
3.19
AVERAGE FAMILY SIZE
7.1/ 100
METRIC RATING
223rd/ 347
METRIC RANK
3.12
AVERAGE FAMILY SIZE
0.1/ 100
METRIC RATING
318th/ 347
METRIC RANK
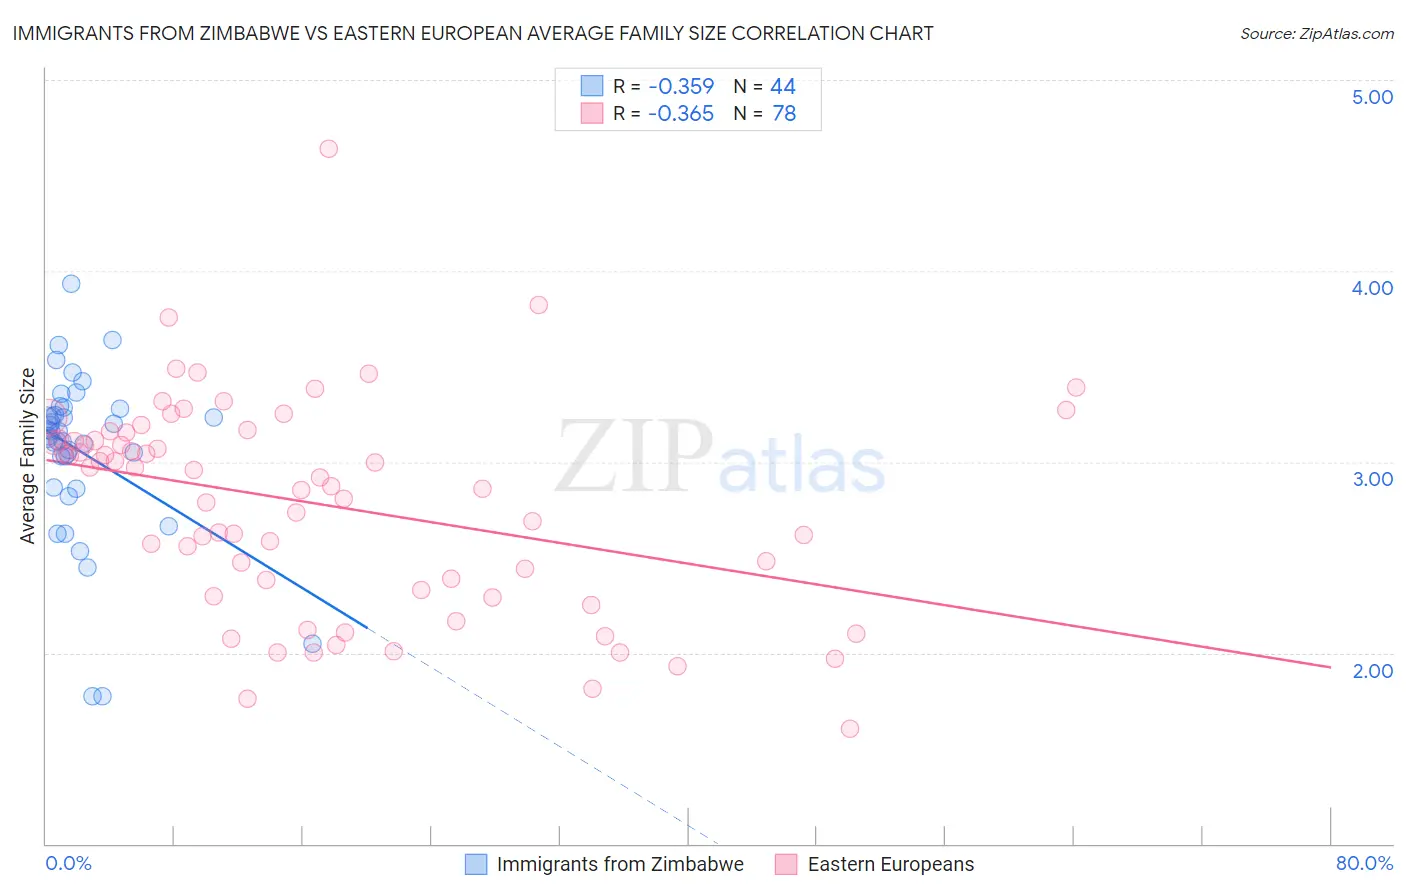
Immigrants from Zimbabwe vs Eastern European Average Family Size Correlation Chart
The statistical analysis conducted on geographies consisting of 117,791,116 people shows a mild negative correlation between the proportion of Immigrants from Zimbabwe and average family size in the United States with a correlation coefficient (R) of -0.359 and weighted average of 3.19. Similarly, the statistical analysis conducted on geographies consisting of 460,961,118 people shows a mild negative correlation between the proportion of Eastern Europeans and average family size in the United States with a correlation coefficient (R) of -0.365 and weighted average of 3.12, a difference of 2.3%.
Average Family Size Correlation Summary
| Measurement | Immigrants from Zimbabwe | Eastern European |
| Minimum | 1.77 | 1.60 |
| Maximum | 3.93 | 4.64 |
| Range | 2.16 | 3.04 |
| Mean | 3.05 | 2.78 |
| Median | 3.15 | 2.90 |
| Interquartile 25% (IQ1) | 2.95 | 2.33 |
| Interquartile 75% (IQ3) | 3.26 | 3.12 |
| Interquartile Range (IQR) | 0.31 | 0.79 |
| Standard Deviation (Sample) | 0.44 | 0.55 |
| Standard Deviation (Population) | 0.43 | 0.55 |
Similar Demographics by Average Family Size
Demographics Similar to Immigrants from Zimbabwe by Average Family Size
In terms of average family size, the demographic groups most similar to Immigrants from Zimbabwe are Immigrants from Ukraine (3.19, a difference of 0.010%), Immigrants from Kuwait (3.19, a difference of 0.010%), Syrian (3.19, a difference of 0.040%), Cree (3.19, a difference of 0.060%), and Chickasaw (3.19, a difference of 0.080%).
| Demographics | Rating | Rank | Average Family Size |
| Bermudans | 11.0 /100 | #216 | Poor 3.20 |
| Immigrants | Somalia | 10.3 /100 | #217 | Poor 3.20 |
| French American Indians | 9.8 /100 | #218 | Tragic 3.20 |
| Pennsylvania Germans | 9.3 /100 | #219 | Tragic 3.19 |
| Lebanese | 9.1 /100 | #220 | Tragic 3.19 |
| Immigrants | Ukraine | 7.2 /100 | #221 | Tragic 3.19 |
| Immigrants | Kuwait | 7.2 /100 | #222 | Tragic 3.19 |
| Immigrants | Zimbabwe | 7.1 /100 | #223 | Tragic 3.19 |
| Syrians | 6.5 /100 | #224 | Tragic 3.19 |
| Cree | 6.2 /100 | #225 | Tragic 3.19 |
| Chickasaw | 6.0 /100 | #226 | Tragic 3.19 |
| Portuguese | 6.0 /100 | #227 | Tragic 3.19 |
| Immigrants | Nonimmigrants | 5.7 /100 | #228 | Tragic 3.19 |
| Immigrants | Italy | 5.3 /100 | #229 | Tragic 3.19 |
| Icelanders | 5.2 /100 | #230 | Tragic 3.19 |
Demographics Similar to Eastern Europeans by Average Family Size
In terms of average family size, the demographic groups most similar to Eastern Europeans are Welsh (3.12, a difference of 0.0%), Italian (3.12, a difference of 0.010%), Serbian (3.12, a difference of 0.070%), Immigrants from North America (3.12, a difference of 0.070%), and Immigrants from Austria (3.12, a difference of 0.10%).
| Demographics | Rating | Rank | Average Family Size |
| Immigrants | Northern Europe | 0.1 /100 | #311 | Tragic 3.13 |
| Immigrants | Australia | 0.1 /100 | #312 | Tragic 3.13 |
| Bulgarians | 0.1 /100 | #313 | Tragic 3.13 |
| Russians | 0.1 /100 | #314 | Tragic 3.12 |
| Immigrants | Scotland | 0.1 /100 | #315 | Tragic 3.12 |
| Serbians | 0.1 /100 | #316 | Tragic 3.12 |
| Italians | 0.1 /100 | #317 | Tragic 3.12 |
| Eastern Europeans | 0.1 /100 | #318 | Tragic 3.12 |
| Welsh | 0.1 /100 | #319 | Tragic 3.12 |
| Immigrants | North America | 0.0 /100 | #320 | Tragic 3.12 |
| Immigrants | Austria | 0.0 /100 | #321 | Tragic 3.12 |
| Immigrants | Canada | 0.0 /100 | #322 | Tragic 3.12 |
| Soviet Union | 0.0 /100 | #323 | Tragic 3.11 |
| Celtics | 0.0 /100 | #324 | Tragic 3.11 |
| English | 0.0 /100 | #325 | Tragic 3.11 |