Israeli vs Immigrants from Indonesia 2nd Grade
COMPARE
Israeli
Immigrants from Indonesia
2nd Grade
2nd Grade Comparison
Israelis
Immigrants from Indonesia
98.0%
2ND GRADE
87.9/ 100
METRIC RATING
138th/ 347
METRIC RANK
97.5%
2ND GRADE
1.2/ 100
METRIC RATING
242nd/ 347
METRIC RANK
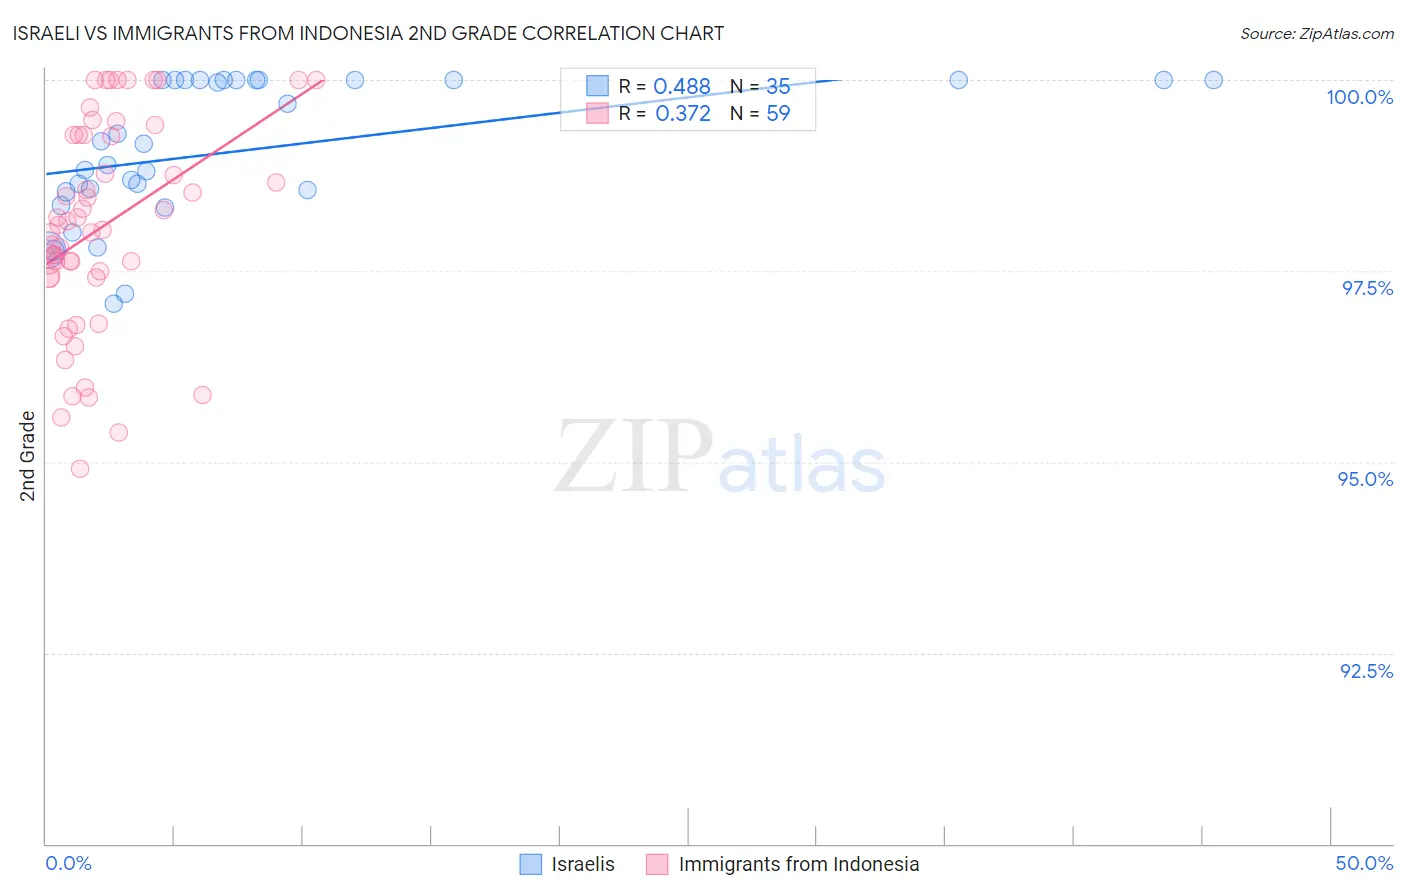
Israeli vs Immigrants from Indonesia 2nd Grade Correlation Chart
The statistical analysis conducted on geographies consisting of 211,219,690 people shows a moderate positive correlation between the proportion of Israelis and percentage of population with at least 2nd grade education in the United States with a correlation coefficient (R) of 0.488 and weighted average of 98.0%. Similarly, the statistical analysis conducted on geographies consisting of 215,782,971 people shows a mild positive correlation between the proportion of Immigrants from Indonesia and percentage of population with at least 2nd grade education in the United States with a correlation coefficient (R) of 0.372 and weighted average of 97.5%, a difference of 0.50%.
2nd Grade Correlation Summary
| Measurement | Israeli | Immigrants from Indonesia |
| Minimum | 97.1% | 94.9% |
| Maximum | 100.0% | 100.0% |
| Range | 2.9% | 5.1% |
| Mean | 99.1% | 98.1% |
| Median | 99.2% | 98.1% |
| Interquartile 25% (IQ1) | 98.5% | 97.4% |
| Interquartile 75% (IQ3) | 100.0% | 99.3% |
| Interquartile Range (IQR) | 1.5% | 1.9% |
| Standard Deviation (Sample) | 0.92% | 1.4% |
| Standard Deviation (Population) | 0.90% | 1.3% |
Similar Demographics by 2nd Grade
Demographics Similar to Israelis by 2nd Grade
In terms of 2nd grade, the demographic groups most similar to Israelis are Immigrants from Romania (98.0%, a difference of 0.0%), Blackfeet (98.0%, a difference of 0.0%), Immigrants from Hungary (98.0%, a difference of 0.010%), Immigrants from Bulgaria (98.0%, a difference of 0.010%), and Immigrants from Kuwait (98.0%, a difference of 0.010%).
| Demographics | Rating | Rank | 2nd Grade |
| Immigrants | Europe | 91.1 /100 | #131 | Exceptional 98.0% |
| Spaniards | 90.7 /100 | #132 | Exceptional 98.0% |
| Cambodians | 90.7 /100 | #133 | Exceptional 98.0% |
| Immigrants | Hungary | 89.7 /100 | #134 | Excellent 98.0% |
| Immigrants | Bulgaria | 89.7 /100 | #135 | Excellent 98.0% |
| Immigrants | Kuwait | 89.2 /100 | #136 | Excellent 98.0% |
| Immigrants | Romania | 88.3 /100 | #137 | Excellent 98.0% |
| Israelis | 87.9 /100 | #138 | Excellent 98.0% |
| Blackfeet | 87.5 /100 | #139 | Excellent 98.0% |
| Palestinians | 83.9 /100 | #140 | Excellent 98.0% |
| Immigrants | Turkey | 83.0 /100 | #141 | Excellent 98.0% |
| Burmese | 81.0 /100 | #142 | Excellent 98.0% |
| Alsatians | 80.5 /100 | #143 | Excellent 98.0% |
| Hmong | 80.0 /100 | #144 | Good 98.0% |
| Filipinos | 79.2 /100 | #145 | Good 98.0% |
Demographics Similar to Immigrants from Indonesia by 2nd Grade
In terms of 2nd grade, the demographic groups most similar to Immigrants from Indonesia are Ethiopian (97.5%, a difference of 0.0%), Korean (97.5%, a difference of 0.010%), Asian (97.5%, a difference of 0.010%), Nigerian (97.6%, a difference of 0.020%), and U.S. Virgin Islander (97.6%, a difference of 0.020%).
| Demographics | Rating | Rank | 2nd Grade |
| Colombians | 1.9 /100 | #235 | Tragic 97.6% |
| Nigerians | 1.7 /100 | #236 | Tragic 97.6% |
| U.S. Virgin Islanders | 1.6 /100 | #237 | Tragic 97.6% |
| Immigrants | Eastern Asia | 1.6 /100 | #238 | Tragic 97.6% |
| Liberians | 1.6 /100 | #239 | Tragic 97.6% |
| Koreans | 1.5 /100 | #240 | Tragic 97.5% |
| Ethiopians | 1.2 /100 | #241 | Tragic 97.5% |
| Immigrants | Indonesia | 1.2 /100 | #242 | Tragic 97.5% |
| Asians | 1.1 /100 | #243 | Tragic 97.5% |
| Immigrants | Iraq | 1.0 /100 | #244 | Tragic 97.5% |
| Immigrants | Eastern Africa | 0.9 /100 | #245 | Tragic 97.5% |
| South Americans | 0.9 /100 | #246 | Tragic 97.5% |
| Immigrants | Senegal | 0.9 /100 | #247 | Tragic 97.5% |
| Immigrants | Middle Africa | 0.9 /100 | #248 | Tragic 97.5% |
| Bolivians | 0.9 /100 | #249 | Tragic 97.5% |