Immigrants from Northern Africa vs Immigrants from Indonesia 2nd Grade
COMPARE
Immigrants from Northern Africa
Immigrants from Indonesia
2nd Grade
2nd Grade Comparison
Immigrants from Northern Africa
Immigrants from Indonesia
97.7%
2ND GRADE
12.3/ 100
METRIC RATING
208th/ 347
METRIC RANK
97.5%
2ND GRADE
1.2/ 100
METRIC RATING
242nd/ 347
METRIC RANK
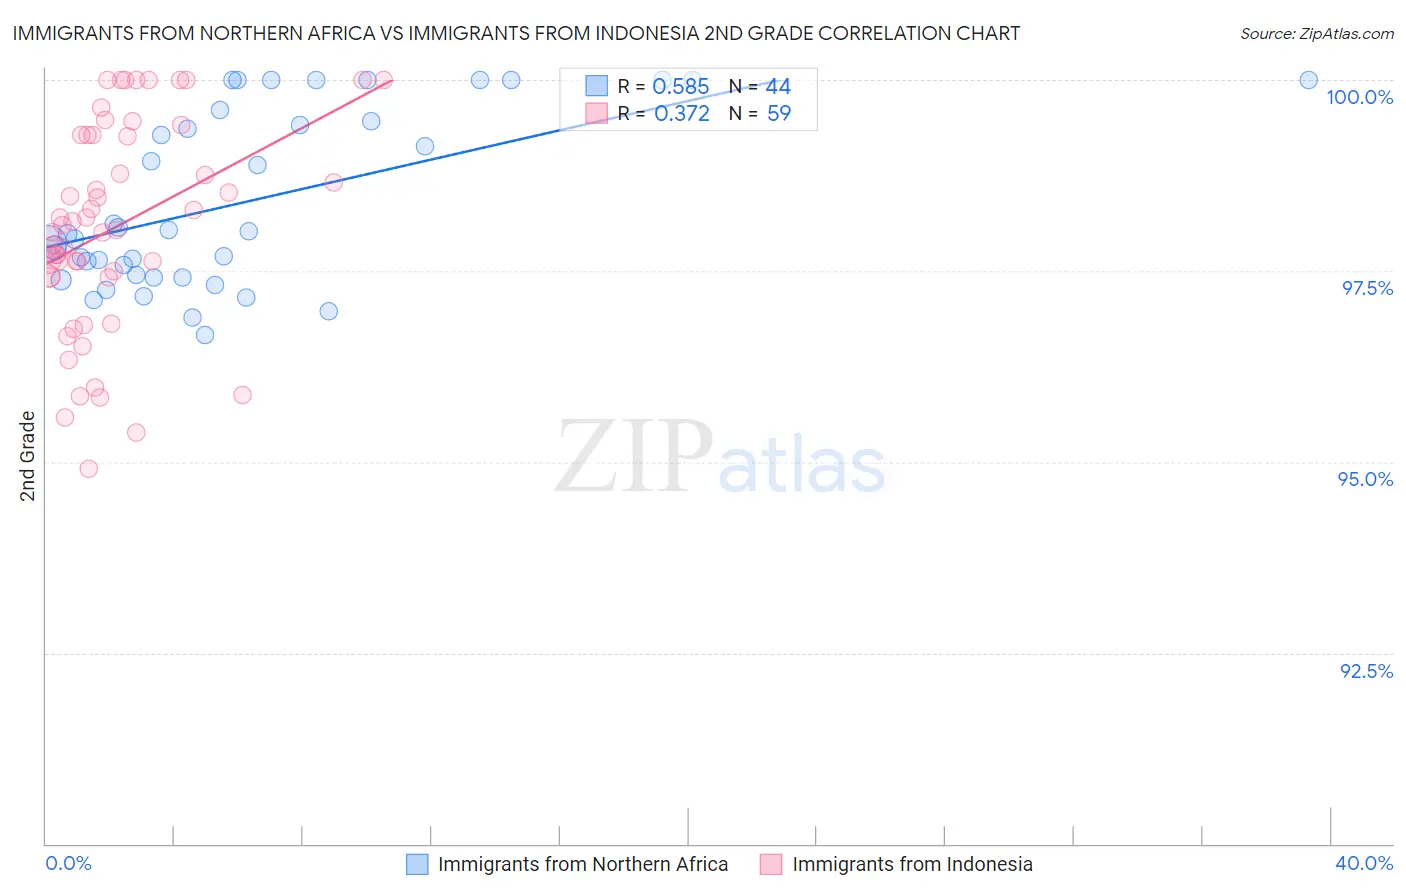
Immigrants from Northern Africa vs Immigrants from Indonesia 2nd Grade Correlation Chart
The statistical analysis conducted on geographies consisting of 321,196,768 people shows a substantial positive correlation between the proportion of Immigrants from Northern Africa and percentage of population with at least 2nd grade education in the United States with a correlation coefficient (R) of 0.585 and weighted average of 97.7%. Similarly, the statistical analysis conducted on geographies consisting of 215,782,971 people shows a mild positive correlation between the proportion of Immigrants from Indonesia and percentage of population with at least 2nd grade education in the United States with a correlation coefficient (R) of 0.372 and weighted average of 97.5%, a difference of 0.19%.
2nd Grade Correlation Summary
| Measurement | Immigrants from Northern Africa | Immigrants from Indonesia |
| Minimum | 96.7% | 94.9% |
| Maximum | 100.0% | 100.0% |
| Range | 3.3% | 5.1% |
| Mean | 98.4% | 98.1% |
| Median | 98.0% | 98.1% |
| Interquartile 25% (IQ1) | 97.4% | 97.4% |
| Interquartile 75% (IQ3) | 99.5% | 99.3% |
| Interquartile Range (IQR) | 2.1% | 1.9% |
| Standard Deviation (Sample) | 1.1% | 1.4% |
| Standard Deviation (Population) | 1.1% | 1.3% |
Similar Demographics by 2nd Grade
Demographics Similar to Immigrants from Northern Africa by 2nd Grade
In terms of 2nd grade, the demographic groups most similar to Immigrants from Northern Africa are Immigrants from Oceania (97.7%, a difference of 0.010%), Costa Rican (97.7%, a difference of 0.010%), African (97.7%, a difference of 0.020%), Laotian (97.7%, a difference of 0.020%), and Immigrants from Chile (97.7%, a difference of 0.030%).
| Demographics | Rating | Rank | 2nd Grade |
| Tohono O'odham | 20.9 /100 | #201 | Fair 97.8% |
| Immigrants | Ukraine | 20.5 /100 | #202 | Fair 97.8% |
| Yuman | 20.0 /100 | #203 | Fair 97.8% |
| Immigrants | Albania | 18.4 /100 | #204 | Poor 97.8% |
| Immigrants | Southern Europe | 18.1 /100 | #205 | Poor 97.8% |
| Immigrants | Chile | 17.3 /100 | #206 | Poor 97.7% |
| Africans | 15.6 /100 | #207 | Poor 97.7% |
| Immigrants | Northern Africa | 12.3 /100 | #208 | Poor 97.7% |
| Immigrants | Oceania | 10.9 /100 | #209 | Poor 97.7% |
| Costa Ricans | 10.5 /100 | #210 | Poor 97.7% |
| Laotians | 9.9 /100 | #211 | Tragic 97.7% |
| Immigrants | Bahamas | 8.4 /100 | #212 | Tragic 97.7% |
| Moroccans | 8.2 /100 | #213 | Tragic 97.7% |
| Samoans | 7.1 /100 | #214 | Tragic 97.7% |
| Bahamians | 6.8 /100 | #215 | Tragic 97.7% |
Demographics Similar to Immigrants from Indonesia by 2nd Grade
In terms of 2nd grade, the demographic groups most similar to Immigrants from Indonesia are Ethiopian (97.5%, a difference of 0.0%), Korean (97.5%, a difference of 0.010%), Asian (97.5%, a difference of 0.010%), Nigerian (97.6%, a difference of 0.020%), and U.S. Virgin Islander (97.6%, a difference of 0.020%).
| Demographics | Rating | Rank | 2nd Grade |
| Colombians | 1.9 /100 | #235 | Tragic 97.6% |
| Nigerians | 1.7 /100 | #236 | Tragic 97.6% |
| U.S. Virgin Islanders | 1.6 /100 | #237 | Tragic 97.6% |
| Immigrants | Eastern Asia | 1.6 /100 | #238 | Tragic 97.6% |
| Liberians | 1.6 /100 | #239 | Tragic 97.6% |
| Koreans | 1.5 /100 | #240 | Tragic 97.5% |
| Ethiopians | 1.2 /100 | #241 | Tragic 97.5% |
| Immigrants | Indonesia | 1.2 /100 | #242 | Tragic 97.5% |
| Asians | 1.1 /100 | #243 | Tragic 97.5% |
| Immigrants | Iraq | 1.0 /100 | #244 | Tragic 97.5% |
| Immigrants | Eastern Africa | 0.9 /100 | #245 | Tragic 97.5% |
| South Americans | 0.9 /100 | #246 | Tragic 97.5% |
| Immigrants | Senegal | 0.9 /100 | #247 | Tragic 97.5% |
| Immigrants | Middle Africa | 0.9 /100 | #248 | Tragic 97.5% |
| Bolivians | 0.9 /100 | #249 | Tragic 97.5% |