Immigrants from Switzerland vs Egyptian Professional Degree
COMPARE
Immigrants from Switzerland
Egyptian
Professional Degree
Professional Degree Comparison
Immigrants from Switzerland
Egyptians
7.1%
PROFESSIONAL DEGREE
100.0/ 100
METRIC RATING
8th/ 347
METRIC RANK
5.3%
PROFESSIONAL DEGREE
99.5/ 100
METRIC RATING
88th/ 347
METRIC RANK
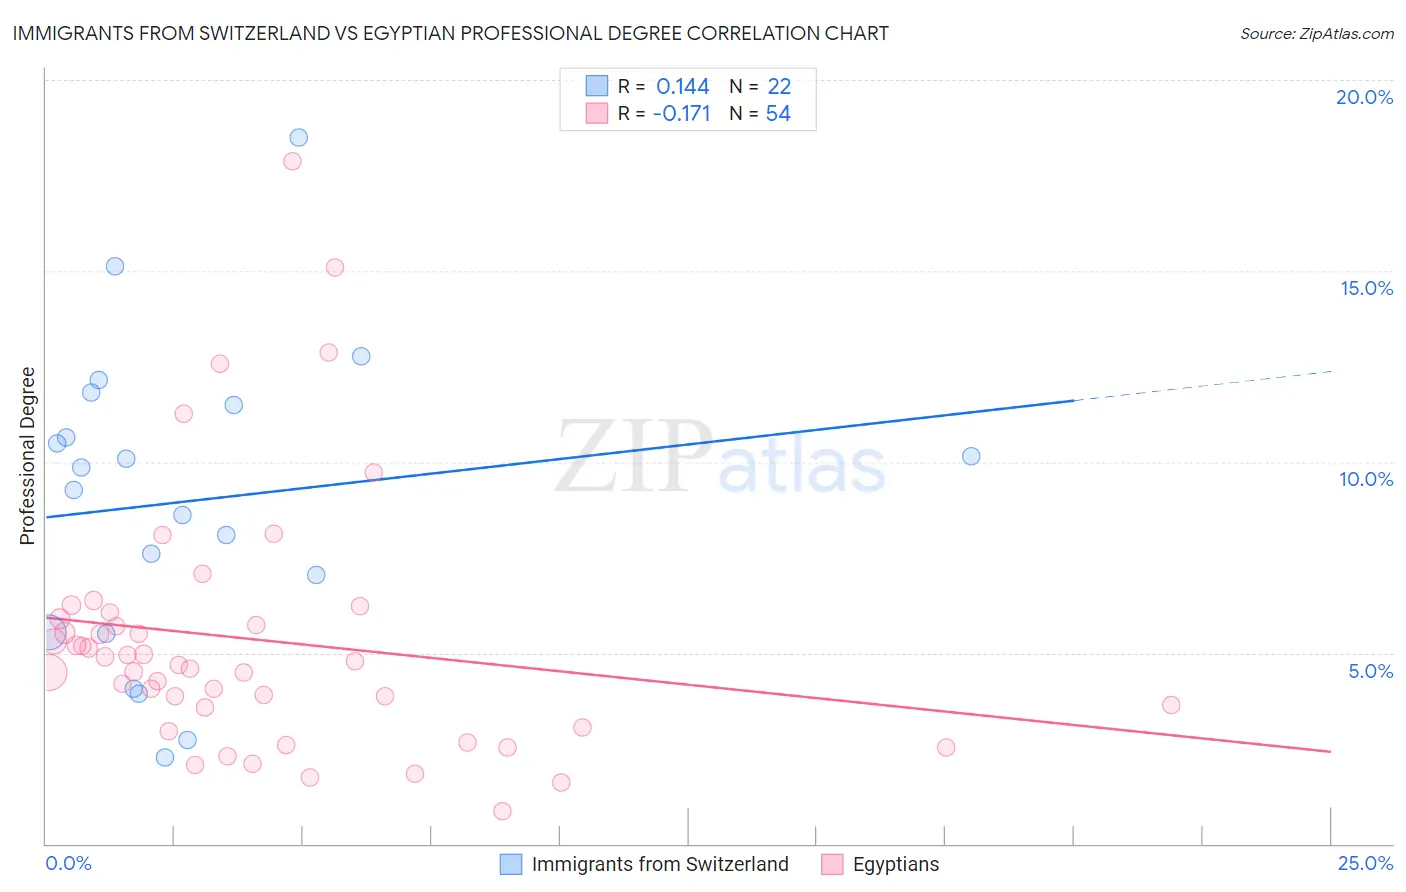
Immigrants from Switzerland vs Egyptian Professional Degree Correlation Chart
The statistical analysis conducted on geographies consisting of 148,038,589 people shows a poor positive correlation between the proportion of Immigrants from Switzerland and percentage of population with at least professional degree education in the United States with a correlation coefficient (R) of 0.144 and weighted average of 7.1%. Similarly, the statistical analysis conducted on geographies consisting of 276,647,843 people shows a poor negative correlation between the proportion of Egyptians and percentage of population with at least professional degree education in the United States with a correlation coefficient (R) of -0.171 and weighted average of 5.3%, a difference of 34.7%.
Professional Degree Correlation Summary
| Measurement | Immigrants from Switzerland | Egyptian |
| Minimum | 2.3% | 0.86% |
| Maximum | 18.5% | 17.9% |
| Range | 16.2% | 17.0% |
| Mean | 9.0% | 5.3% |
| Median | 9.6% | 4.7% |
| Interquartile 25% (IQ1) | 5.5% | 3.6% |
| Interquartile 75% (IQ3) | 11.5% | 5.9% |
| Interquartile Range (IQR) | 5.9% | 2.3% |
| Standard Deviation (Sample) | 4.0% | 3.3% |
| Standard Deviation (Population) | 3.9% | 3.3% |
Similar Demographics by Professional Degree
Demographics Similar to Immigrants from Switzerland by Professional Degree
In terms of professional degree, the demographic groups most similar to Immigrants from Switzerland are Eastern European (7.1%, a difference of 0.14%), Immigrants from Taiwan (7.1%, a difference of 0.19%), Immigrants from Belgium (7.0%, a difference of 1.9%), Cypriot (6.9%, a difference of 2.1%), and Israeli (6.9%, a difference of 2.2%).
| Demographics | Rating | Rank | Professional Degree |
| Immigrants | Israel | 100.0 /100 | #1 | Exceptional 7.9% |
| Immigrants | Singapore | 100.0 /100 | #2 | Exceptional 7.7% |
| Iranians | 100.0 /100 | #3 | Exceptional 7.6% |
| Filipinos | 100.0 /100 | #4 | Exceptional 7.6% |
| Immigrants | Iran | 100.0 /100 | #5 | Exceptional 7.3% |
| Okinawans | 100.0 /100 | #6 | Exceptional 7.3% |
| Eastern Europeans | 100.0 /100 | #7 | Exceptional 7.1% |
| Immigrants | Switzerland | 100.0 /100 | #8 | Exceptional 7.1% |
| Immigrants | Taiwan | 100.0 /100 | #9 | Exceptional 7.1% |
| Immigrants | Belgium | 100.0 /100 | #10 | Exceptional 7.0% |
| Cypriots | 100.0 /100 | #11 | Exceptional 6.9% |
| Israelis | 100.0 /100 | #12 | Exceptional 6.9% |
| Immigrants | Australia | 100.0 /100 | #13 | Exceptional 6.9% |
| Immigrants | France | 100.0 /100 | #14 | Exceptional 6.8% |
| Immigrants | China | 100.0 /100 | #15 | Exceptional 6.7% |
Demographics Similar to Egyptians by Professional Degree
In terms of professional degree, the demographic groups most similar to Egyptians are Chilean (5.3%, a difference of 0.0%), Immigrants from Scotland (5.3%, a difference of 0.10%), Immigrants from Chile (5.3%, a difference of 0.14%), Immigrants from Zimbabwe (5.3%, a difference of 0.25%), and Greek (5.3%, a difference of 0.25%).
| Demographics | Rating | Rank | Professional Degree |
| Immigrants | Brazil | 99.6 /100 | #81 | Exceptional 5.3% |
| Romanians | 99.6 /100 | #82 | Exceptional 5.3% |
| Carpatho Rusyns | 99.6 /100 | #83 | Exceptional 5.3% |
| Immigrants | Croatia | 99.6 /100 | #84 | Exceptional 5.3% |
| Immigrants | Zimbabwe | 99.6 /100 | #85 | Exceptional 5.3% |
| Greeks | 99.6 /100 | #86 | Exceptional 5.3% |
| Immigrants | Chile | 99.5 /100 | #87 | Exceptional 5.3% |
| Egyptians | 99.5 /100 | #88 | Exceptional 5.3% |
| Chileans | 99.5 /100 | #89 | Exceptional 5.3% |
| Immigrants | Scotland | 99.5 /100 | #90 | Exceptional 5.3% |
| Laotians | 99.5 /100 | #91 | Exceptional 5.2% |
| Immigrants | Eastern Europe | 99.5 /100 | #92 | Exceptional 5.2% |
| Northern Europeans | 99.3 /100 | #93 | Exceptional 5.2% |
| Alsatians | 99.3 /100 | #94 | Exceptional 5.2% |
| Zimbabweans | 99.3 /100 | #95 | Exceptional 5.2% |