Immigrants from Zaire vs Nicaraguan Professional Degree
COMPARE
Immigrants from Zaire
Nicaraguan
Professional Degree
Professional Degree Comparison
Immigrants from Zaire
Nicaraguans
4.5%
PROFESSIONAL DEGREE
57.4/ 100
METRIC RATING
170th/ 347
METRIC RANK
3.9%
PROFESSIONAL DEGREE
5.1/ 100
METRIC RATING
230th/ 347
METRIC RANK
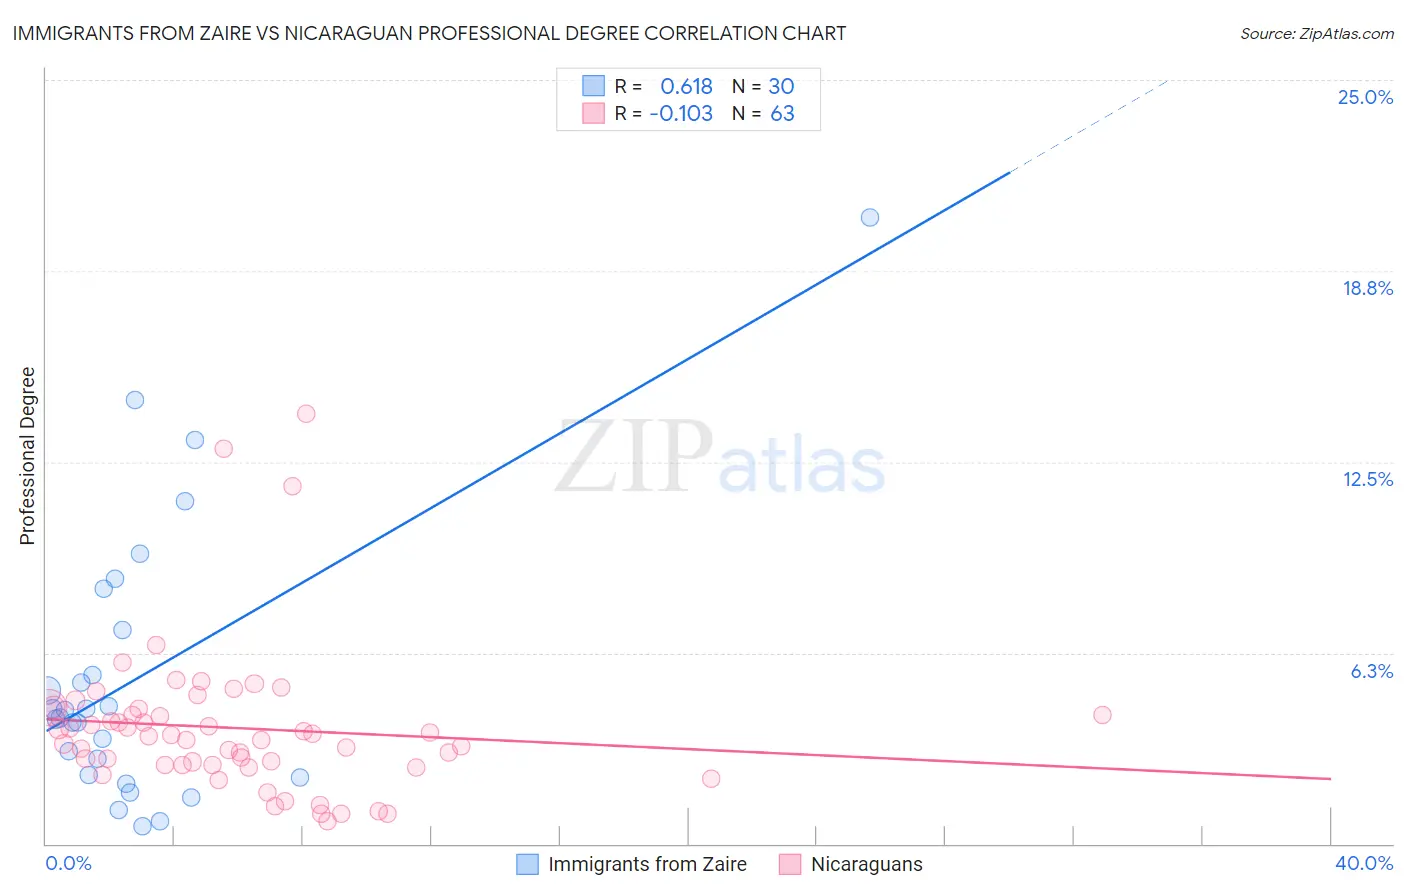
Immigrants from Zaire vs Nicaraguan Professional Degree Correlation Chart
The statistical analysis conducted on geographies consisting of 107,228,641 people shows a significant positive correlation between the proportion of Immigrants from Zaire and percentage of population with at least professional degree education in the United States with a correlation coefficient (R) of 0.618 and weighted average of 4.5%. Similarly, the statistical analysis conducted on geographies consisting of 285,287,812 people shows a poor negative correlation between the proportion of Nicaraguans and percentage of population with at least professional degree education in the United States with a correlation coefficient (R) of -0.103 and weighted average of 3.9%, a difference of 13.1%.
Professional Degree Correlation Summary
| Measurement | Immigrants from Zaire | Nicaraguan |
| Minimum | 0.59% | 0.72% |
| Maximum | 20.5% | 14.1% |
| Range | 19.9% | 13.4% |
| Mean | 5.5% | 3.8% |
| Median | 4.2% | 3.5% |
| Interquartile 25% (IQ1) | 2.3% | 2.6% |
| Interquartile 75% (IQ3) | 7.0% | 4.4% |
| Interquartile Range (IQR) | 4.7% | 1.8% |
| Standard Deviation (Sample) | 4.5% | 2.4% |
| Standard Deviation (Population) | 4.5% | 2.4% |
Similar Demographics by Professional Degree
Demographics Similar to Immigrants from Zaire by Professional Degree
In terms of professional degree, the demographic groups most similar to Immigrants from Zaire are Chinese (4.5%, a difference of 0.18%), Immigrants from Sierra Leone (4.5%, a difference of 0.19%), Immigrants from Bangladesh (4.4%, a difference of 0.22%), Immigrants from Afghanistan (4.5%, a difference of 0.26%), and Immigrants from Colombia (4.5%, a difference of 0.29%).
| Demographics | Rating | Rank | Professional Degree |
| Sierra Leoneans | 64.3 /100 | #163 | Good 4.5% |
| Swiss | 61.0 /100 | #164 | Good 4.5% |
| Costa Ricans | 59.9 /100 | #165 | Average 4.5% |
| Immigrants | Colombia | 59.4 /100 | #166 | Average 4.5% |
| Immigrants | Afghanistan | 59.2 /100 | #167 | Average 4.5% |
| Immigrants | Sierra Leone | 58.7 /100 | #168 | Average 4.5% |
| Chinese | 58.6 /100 | #169 | Average 4.5% |
| Immigrants | Zaire | 57.4 /100 | #170 | Average 4.5% |
| Immigrants | Bangladesh | 56.0 /100 | #171 | Average 4.4% |
| Spaniards | 52.0 /100 | #172 | Average 4.4% |
| English | 50.1 /100 | #173 | Average 4.4% |
| Kenyans | 50.0 /100 | #174 | Average 4.4% |
| Irish | 50.0 /100 | #175 | Average 4.4% |
| Immigrants | Peru | 49.3 /100 | #176 | Average 4.4% |
| Celtics | 47.6 /100 | #177 | Average 4.4% |
Demographics Similar to Nicaraguans by Professional Degree
In terms of professional degree, the demographic groups most similar to Nicaraguans are Immigrants from Burma/Myanmar (3.9%, a difference of 0.27%), Immigrants from West Indies (4.0%, a difference of 0.42%), Ecuadorian (3.9%, a difference of 0.46%), Cuban (4.0%, a difference of 0.67%), and Cree (3.9%, a difference of 0.67%).
| Demographics | Rating | Rank | Professional Degree |
| Immigrants | Bosnia and Herzegovina | 7.4 /100 | #223 | Tragic 4.0% |
| Trinidadians and Tobagonians | 7.1 /100 | #224 | Tragic 4.0% |
| Tlingit-Haida | 6.9 /100 | #225 | Tragic 4.0% |
| German Russians | 6.1 /100 | #226 | Tragic 4.0% |
| Cubans | 5.9 /100 | #227 | Tragic 4.0% |
| Immigrants | West Indies | 5.6 /100 | #228 | Tragic 4.0% |
| Immigrants | Burma/Myanmar | 5.4 /100 | #229 | Tragic 3.9% |
| Nicaraguans | 5.1 /100 | #230 | Tragic 3.9% |
| Ecuadorians | 4.6 /100 | #231 | Tragic 3.9% |
| Cree | 4.3 /100 | #232 | Tragic 3.9% |
| Immigrants | Philippines | 4.1 /100 | #233 | Tragic 3.9% |
| Immigrants | Nonimmigrants | 4.0 /100 | #234 | Tragic 3.9% |
| Immigrants | Barbados | 4.0 /100 | #235 | Tragic 3.9% |
| Spanish Americans | 3.8 /100 | #236 | Tragic 3.9% |
| Immigrants | Trinidad and Tobago | 3.8 /100 | #237 | Tragic 3.9% |