Immigrants from South America vs Egyptian Professional Degree
COMPARE
Immigrants from South America
Egyptian
Professional Degree
Professional Degree Comparison
Immigrants from South America
Egyptians
4.6%
PROFESSIONAL DEGREE
80.5/ 100
METRIC RATING
144th/ 347
METRIC RANK
5.3%
PROFESSIONAL DEGREE
99.5/ 100
METRIC RATING
88th/ 347
METRIC RANK
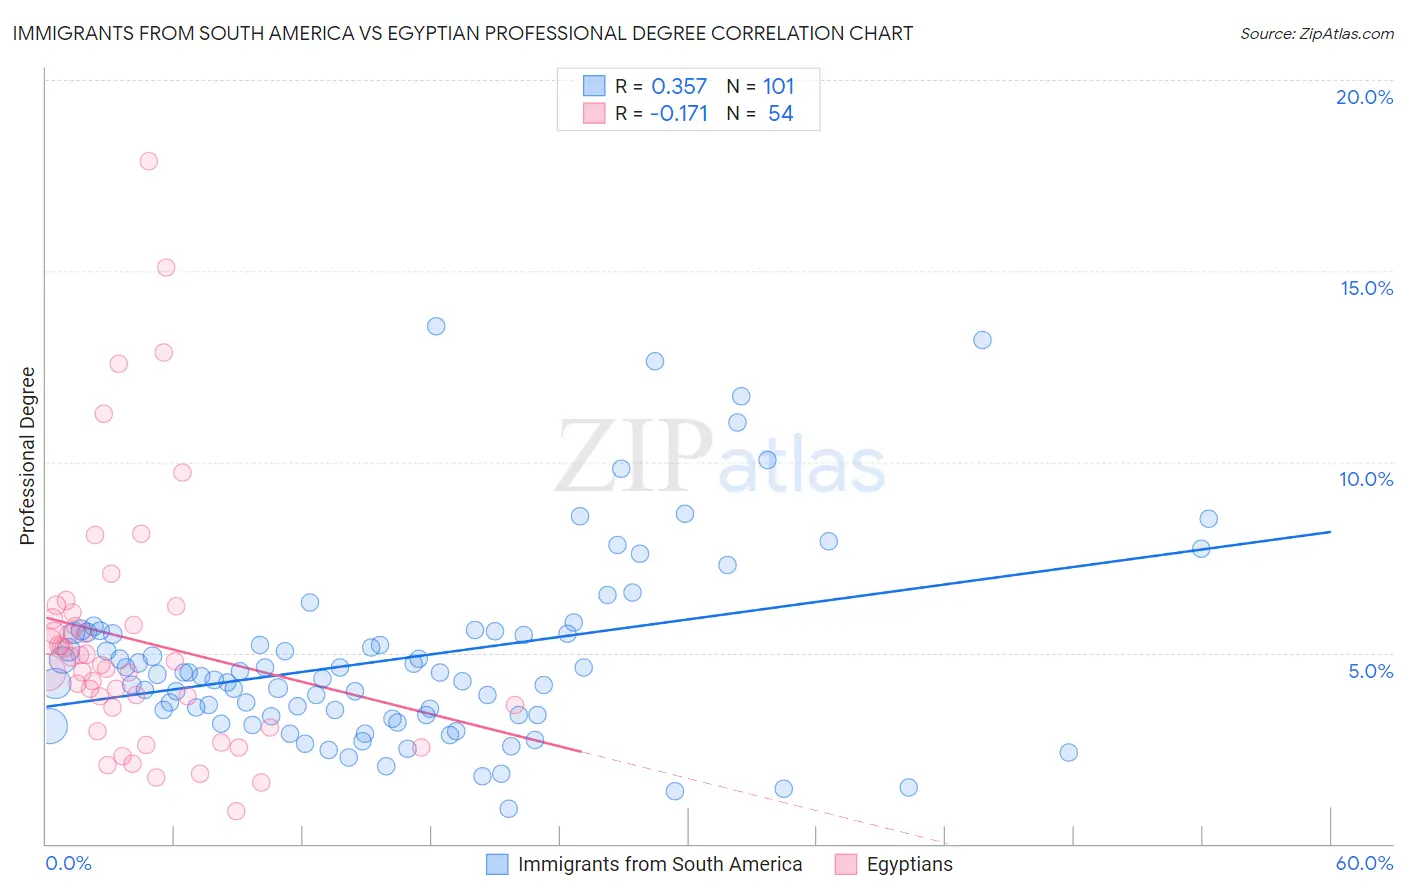
Immigrants from South America vs Egyptian Professional Degree Correlation Chart
The statistical analysis conducted on geographies consisting of 484,634,424 people shows a mild positive correlation between the proportion of Immigrants from South America and percentage of population with at least professional degree education in the United States with a correlation coefficient (R) of 0.357 and weighted average of 4.6%. Similarly, the statistical analysis conducted on geographies consisting of 276,647,843 people shows a poor negative correlation between the proportion of Egyptians and percentage of population with at least professional degree education in the United States with a correlation coefficient (R) of -0.171 and weighted average of 5.3%, a difference of 13.5%.
Professional Degree Correlation Summary
| Measurement | Immigrants from South America | Egyptian |
| Minimum | 0.92% | 0.86% |
| Maximum | 13.6% | 17.9% |
| Range | 12.6% | 17.0% |
| Mean | 4.8% | 5.3% |
| Median | 4.4% | 4.7% |
| Interquartile 25% (IQ1) | 3.3% | 3.6% |
| Interquartile 75% (IQ3) | 5.5% | 5.9% |
| Interquartile Range (IQR) | 2.2% | 2.3% |
| Standard Deviation (Sample) | 2.5% | 3.3% |
| Standard Deviation (Population) | 2.5% | 3.3% |
Similar Demographics by Professional Degree
Demographics Similar to Immigrants from South America by Professional Degree
In terms of professional degree, the demographic groups most similar to Immigrants from South America are Uruguayan (4.6%, a difference of 0.060%), Hungarian (4.6%, a difference of 0.070%), Sudanese (4.6%, a difference of 0.18%), Basque (4.6%, a difference of 0.31%), and Luxembourger (4.6%, a difference of 0.37%).
| Demographics | Rating | Rank | Professional Degree |
| Jordanians | 88.9 /100 | #137 | Excellent 4.7% |
| Afghans | 88.8 /100 | #138 | Excellent 4.7% |
| South Americans | 85.6 /100 | #139 | Excellent 4.7% |
| Canadians | 84.4 /100 | #140 | Excellent 4.7% |
| Basques | 81.8 /100 | #141 | Excellent 4.6% |
| Sudanese | 81.3 /100 | #142 | Excellent 4.6% |
| Hungarians | 80.8 /100 | #143 | Excellent 4.6% |
| Immigrants | South America | 80.5 /100 | #144 | Excellent 4.6% |
| Uruguayans | 80.2 /100 | #145 | Excellent 4.6% |
| Luxembourgers | 78.7 /100 | #146 | Good 4.6% |
| Colombians | 77.7 /100 | #147 | Good 4.6% |
| Slovenes | 76.1 /100 | #148 | Good 4.6% |
| Senegalese | 75.3 /100 | #149 | Good 4.6% |
| Immigrants | Oceania | 73.4 /100 | #150 | Good 4.6% |
| Poles | 72.6 /100 | #151 | Good 4.6% |
Demographics Similar to Egyptians by Professional Degree
In terms of professional degree, the demographic groups most similar to Egyptians are Chilean (5.3%, a difference of 0.0%), Immigrants from Scotland (5.3%, a difference of 0.10%), Immigrants from Chile (5.3%, a difference of 0.14%), Immigrants from Zimbabwe (5.3%, a difference of 0.25%), and Greek (5.3%, a difference of 0.25%).
| Demographics | Rating | Rank | Professional Degree |
| Immigrants | Brazil | 99.6 /100 | #81 | Exceptional 5.3% |
| Romanians | 99.6 /100 | #82 | Exceptional 5.3% |
| Carpatho Rusyns | 99.6 /100 | #83 | Exceptional 5.3% |
| Immigrants | Croatia | 99.6 /100 | #84 | Exceptional 5.3% |
| Immigrants | Zimbabwe | 99.6 /100 | #85 | Exceptional 5.3% |
| Greeks | 99.6 /100 | #86 | Exceptional 5.3% |
| Immigrants | Chile | 99.5 /100 | #87 | Exceptional 5.3% |
| Egyptians | 99.5 /100 | #88 | Exceptional 5.3% |
| Chileans | 99.5 /100 | #89 | Exceptional 5.3% |
| Immigrants | Scotland | 99.5 /100 | #90 | Exceptional 5.3% |
| Laotians | 99.5 /100 | #91 | Exceptional 5.2% |
| Immigrants | Eastern Europe | 99.5 /100 | #92 | Exceptional 5.2% |
| Northern Europeans | 99.3 /100 | #93 | Exceptional 5.2% |
| Alsatians | 99.3 /100 | #94 | Exceptional 5.2% |
| Zimbabweans | 99.3 /100 | #95 | Exceptional 5.2% |