Immigrants from Yemen vs Hispanic or Latino Female Poverty Among 18-24 Year Olds
COMPARE
Immigrants from Yemen
Hispanic or Latino
Female Poverty Among 18-24 Year Olds
Female Poverty Among 18-24 Year Olds Comparison
Immigrants from Yemen
Hispanics or Latinos
27.5%
FEMALE POVERTY AMONG 18-24 YEAR OLDS
0.0/ 100
METRIC RATING
336th/ 347
METRIC RANK
20.5%
FEMALE POVERTY AMONG 18-24 YEAR OLDS
16.6/ 100
METRIC RATING
206th/ 347
METRIC RANK
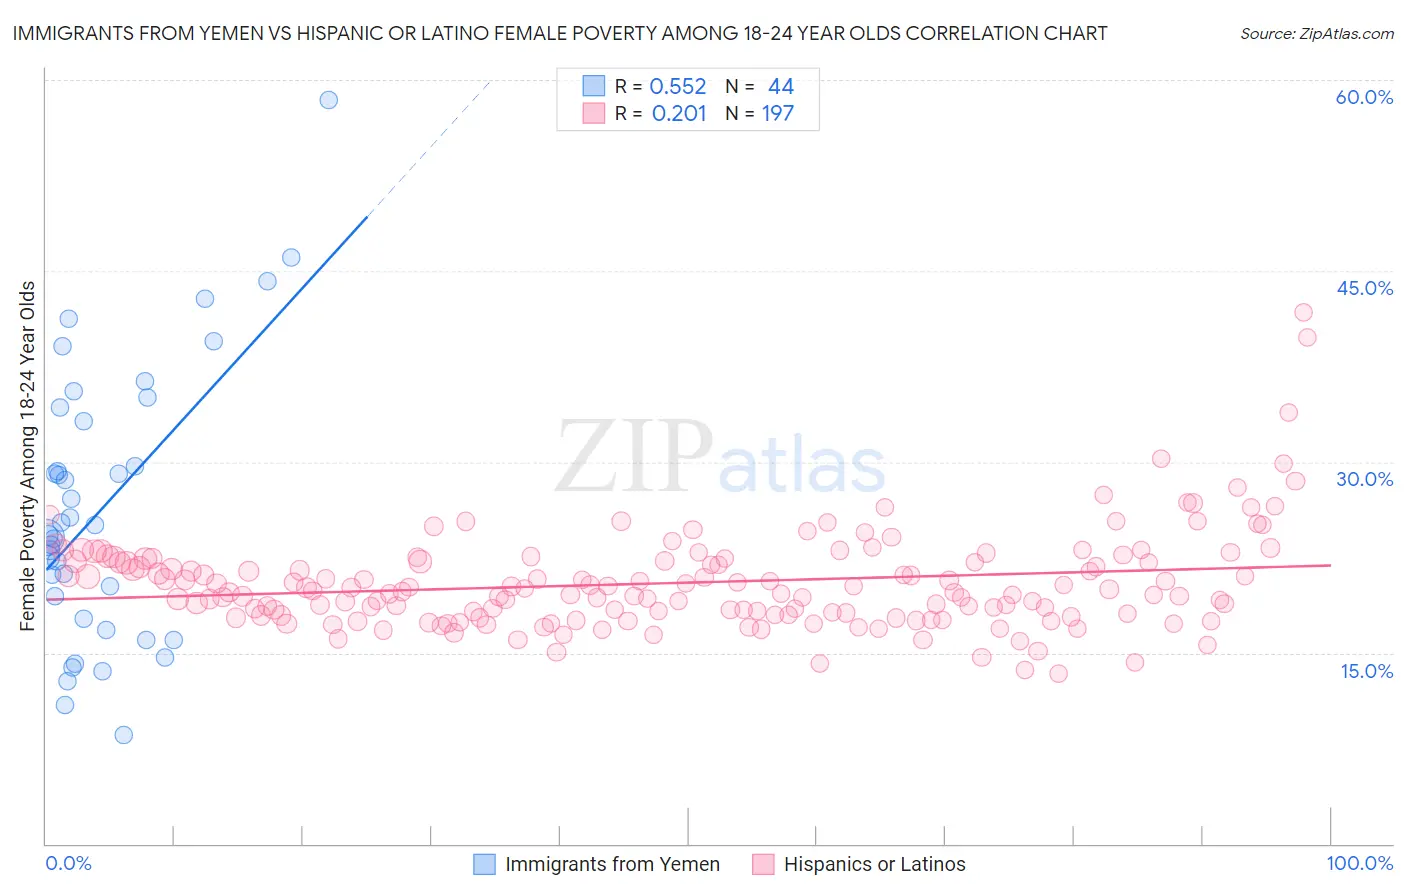
Immigrants from Yemen vs Hispanic or Latino Female Poverty Among 18-24 Year Olds Correlation Chart
The statistical analysis conducted on geographies consisting of 82,141,466 people shows a substantial positive correlation between the proportion of Immigrants from Yemen and poverty level among females between the ages 18 and 24 in the United States with a correlation coefficient (R) of 0.552 and weighted average of 27.5%. Similarly, the statistical analysis conducted on geographies consisting of 539,347,372 people shows a weak positive correlation between the proportion of Hispanics or Latinos and poverty level among females between the ages 18 and 24 in the United States with a correlation coefficient (R) of 0.201 and weighted average of 20.5%, a difference of 34.4%.
Female Poverty Among 18-24 Year Olds Correlation Summary
| Measurement | Immigrants from Yemen | Hispanic or Latino |
| Minimum | 8.5% | 13.4% |
| Maximum | 58.5% | 41.7% |
| Range | 49.9% | 28.4% |
| Mean | 26.4% | 20.5% |
| Median | 24.6% | 19.8% |
| Interquartile 25% (IQ1) | 18.6% | 18.0% |
| Interquartile 75% (IQ3) | 33.7% | 22.2% |
| Interquartile Range (IQR) | 15.1% | 4.2% |
| Standard Deviation (Sample) | 10.7% | 3.8% |
| Standard Deviation (Population) | 10.6% | 3.8% |
Similar Demographics by Female Poverty Among 18-24 Year Olds
Demographics Similar to Immigrants from Yemen by Female Poverty Among 18-24 Year Olds
In terms of female poverty among 18-24 year olds, the demographic groups most similar to Immigrants from Yemen are Yup'ik (27.0%, a difference of 1.9%), Cheyenne (28.1%, a difference of 2.2%), Hopi (28.2%, a difference of 2.4%), Pueblo (26.9%, a difference of 2.4%), and Pima (28.4%, a difference of 3.1%).
| Demographics | Rating | Rank | Female Poverty Among 18-24 Year Olds |
| Cajuns | 0.0 /100 | #329 | Tragic 25.7% |
| Immigrants | Somalia | 0.0 /100 | #330 | Tragic 25.7% |
| Chippewa | 0.0 /100 | #331 | Tragic 25.9% |
| Houma | 0.0 /100 | #332 | Tragic 26.2% |
| Apache | 0.0 /100 | #333 | Tragic 26.3% |
| Pueblo | 0.0 /100 | #334 | Tragic 26.9% |
| Yup'ik | 0.0 /100 | #335 | Tragic 27.0% |
| Immigrants | Yemen | 0.0 /100 | #336 | Tragic 27.5% |
| Cheyenne | 0.0 /100 | #337 | Tragic 28.1% |
| Hopi | 0.0 /100 | #338 | Tragic 28.2% |
| Pima | 0.0 /100 | #339 | Tragic 28.4% |
| Sioux | 0.0 /100 | #340 | Tragic 28.6% |
| Colville | 0.0 /100 | #341 | Tragic 29.0% |
| Kiowa | 0.0 /100 | #342 | Tragic 29.2% |
| Puerto Ricans | 0.0 /100 | #343 | Tragic 29.8% |
Demographics Similar to Hispanics or Latinos by Female Poverty Among 18-24 Year Olds
In terms of female poverty among 18-24 year olds, the demographic groups most similar to Hispanics or Latinos are English (20.5%, a difference of 0.010%), Immigrants from Netherlands (20.5%, a difference of 0.030%), Spaniard (20.5%, a difference of 0.030%), Immigrants from Malaysia (20.5%, a difference of 0.050%), and Dutch (20.5%, a difference of 0.070%).
| Demographics | Rating | Rank | Female Poverty Among 18-24 Year Olds |
| Germans | 20.6 /100 | #199 | Fair 20.4% |
| Europeans | 19.9 /100 | #200 | Poor 20.4% |
| Mexicans | 18.3 /100 | #201 | Poor 20.5% |
| Immigrants | Turkey | 17.7 /100 | #202 | Poor 20.5% |
| Immigrants | Malaysia | 17.2 /100 | #203 | Poor 20.5% |
| Immigrants | Netherlands | 17.0 /100 | #204 | Poor 20.5% |
| English | 16.7 /100 | #205 | Poor 20.5% |
| Hispanics or Latinos | 16.6 /100 | #206 | Poor 20.5% |
| Spaniards | 16.3 /100 | #207 | Poor 20.5% |
| Dutch | 15.9 /100 | #208 | Poor 20.5% |
| Arabs | 15.5 /100 | #209 | Poor 20.5% |
| Immigrants | Ghana | 14.3 /100 | #210 | Poor 20.5% |
| Immigrants | Western Europe | 13.5 /100 | #211 | Poor 20.6% |
| Liberians | 11.6 /100 | #212 | Poor 20.6% |
| Northern Europeans | 11.6 /100 | #213 | Poor 20.6% |