Immigrants from Brazil vs Guamanian/Chamorro 3rd Grade
COMPARE
Immigrants from Brazil
Guamanian/Chamorro
3rd Grade
3rd Grade Comparison
Immigrants from Brazil
Guamanians/Chamorros
97.7%
3RD GRADE
46.4/ 100
METRIC RATING
178th/ 347
METRIC RANK
97.7%
3RD GRADE
23.6/ 100
METRIC RATING
198th/ 347
METRIC RANK
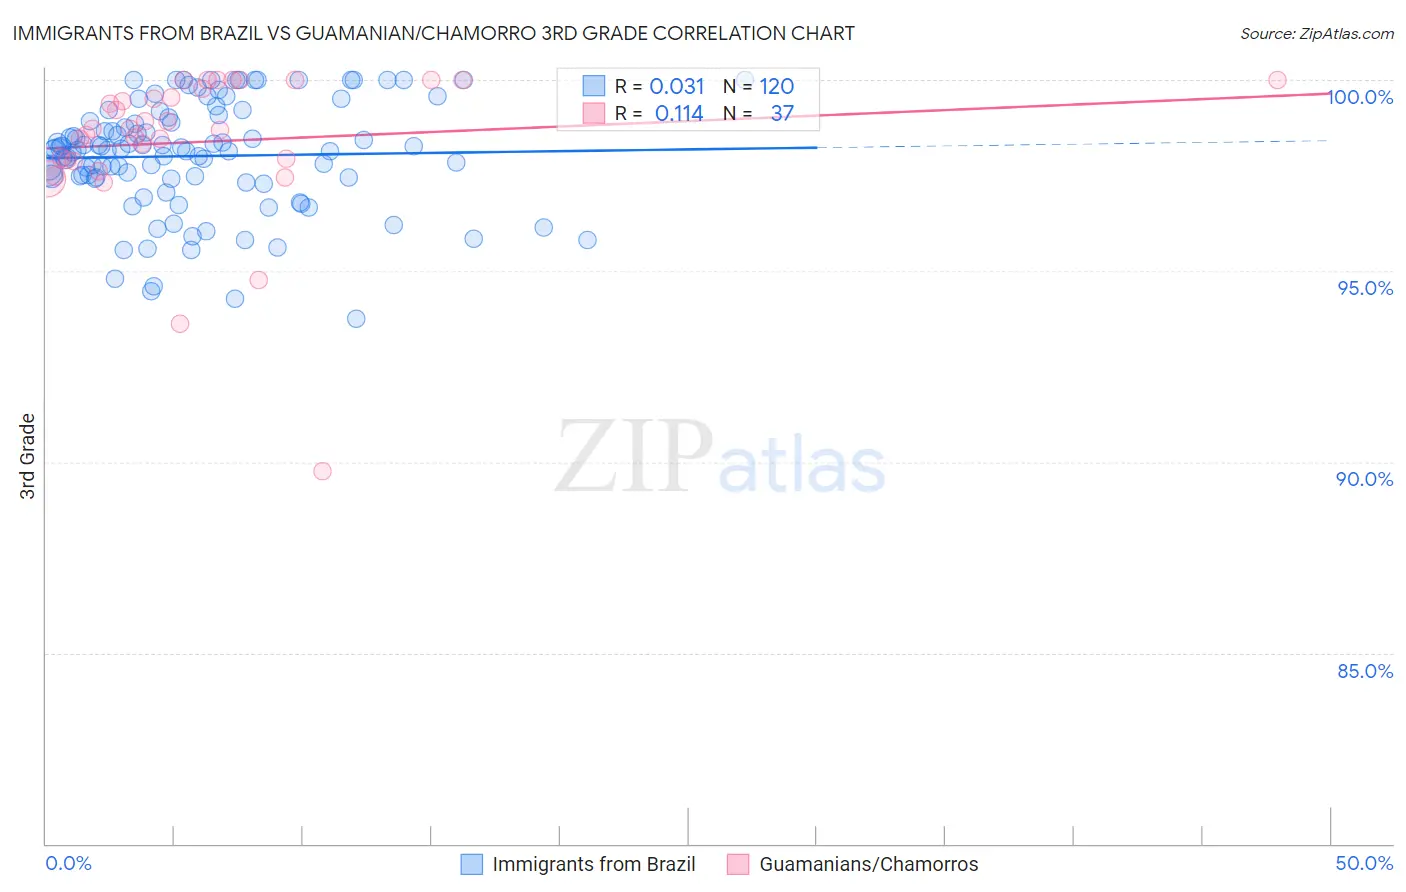
Immigrants from Brazil vs Guamanian/Chamorro 3rd Grade Correlation Chart
The statistical analysis conducted on geographies consisting of 343,021,580 people shows no correlation between the proportion of Immigrants from Brazil and percentage of population with at least 3rd grade education in the United States with a correlation coefficient (R) of 0.031 and weighted average of 97.7%. Similarly, the statistical analysis conducted on geographies consisting of 221,965,618 people shows a poor positive correlation between the proportion of Guamanians/Chamorros and percentage of population with at least 3rd grade education in the United States with a correlation coefficient (R) of 0.114 and weighted average of 97.7%, a difference of 0.090%.
3rd Grade Correlation Summary
| Measurement | Immigrants from Brazil | Guamanian/Chamorro |
| Minimum | 93.7% | 89.7% |
| Maximum | 100.0% | 100.0% |
| Range | 6.3% | 10.3% |
| Mean | 98.0% | 98.4% |
| Median | 98.2% | 98.7% |
| Interquartile 25% (IQ1) | 97.4% | 97.9% |
| Interquartile 75% (IQ3) | 99.0% | 99.9% |
| Interquartile Range (IQR) | 1.5% | 2.0% |
| Standard Deviation (Sample) | 1.4% | 2.0% |
| Standard Deviation (Population) | 1.4% | 2.0% |
Demographics Similar to Immigrants from Brazil and Guamanians/Chamorros by 3rd Grade
In terms of 3rd grade, the demographic groups most similar to Immigrants from Brazil are Immigrants from Belarus (97.7%, a difference of 0.0%), Immigrants from Sri Lanka (97.7%, a difference of 0.0%), Immigrants from Venezuela (97.7%, a difference of 0.010%), Argentinean (97.7%, a difference of 0.010%), and Arab (97.7%, a difference of 0.020%). Similarly, the demographic groups most similar to Guamanians/Chamorros are Immigrants from Egypt (97.7%, a difference of 0.010%), Paraguayan (97.7%, a difference of 0.010%), Hawaiian (97.7%, a difference of 0.010%), Mongolian (97.7%, a difference of 0.020%), and Immigrants from Kenya (97.7%, a difference of 0.020%).
| Demographics | Rating | Rank | 3rd Grade |
| Immigrants | Brazil | 46.4 /100 | #178 | Average 97.7% |
| Immigrants | Belarus | 45.9 /100 | #179 | Average 97.7% |
| Immigrants | Sri Lanka | 45.1 /100 | #180 | Average 97.7% |
| Immigrants | Venezuela | 44.4 /100 | #181 | Average 97.7% |
| Argentineans | 42.9 /100 | #182 | Average 97.7% |
| Arabs | 40.0 /100 | #183 | Fair 97.7% |
| Immigrants | Kazakhstan | 37.4 /100 | #184 | Fair 97.7% |
| Immigrants | Argentina | 37.0 /100 | #185 | Fair 97.7% |
| Portuguese | 36.2 /100 | #186 | Fair 97.7% |
| Natives/Alaskans | 35.2 /100 | #187 | Fair 97.7% |
| Immigrants | Taiwan | 34.2 /100 | #188 | Fair 97.7% |
| Pakistanis | 34.2 /100 | #189 | Fair 97.7% |
| Panamanians | 31.5 /100 | #190 | Fair 97.7% |
| Blacks/African Americans | 29.6 /100 | #191 | Fair 97.7% |
| Mongolians | 29.1 /100 | #192 | Fair 97.7% |
| Immigrants | Kenya | 28.2 /100 | #193 | Fair 97.7% |
| Immigrants | Uganda | 27.4 /100 | #194 | Fair 97.7% |
| Immigrants | Egypt | 26.8 /100 | #195 | Fair 97.7% |
| Paraguayans | 26.2 /100 | #196 | Fair 97.7% |
| Hawaiians | 25.7 /100 | #197 | Fair 97.7% |
| Guamanians/Chamorros | 23.6 /100 | #198 | Fair 97.7% |