Sudanese vs Guamanian/Chamorro 3rd Grade
COMPARE
Sudanese
Guamanian/Chamorro
3rd Grade
3rd Grade Comparison
Sudanese
Guamanians/Chamorros
97.5%
3RD GRADE
4.1/ 100
METRIC RATING
226th/ 347
METRIC RANK
97.7%
3RD GRADE
23.6/ 100
METRIC RATING
198th/ 347
METRIC RANK
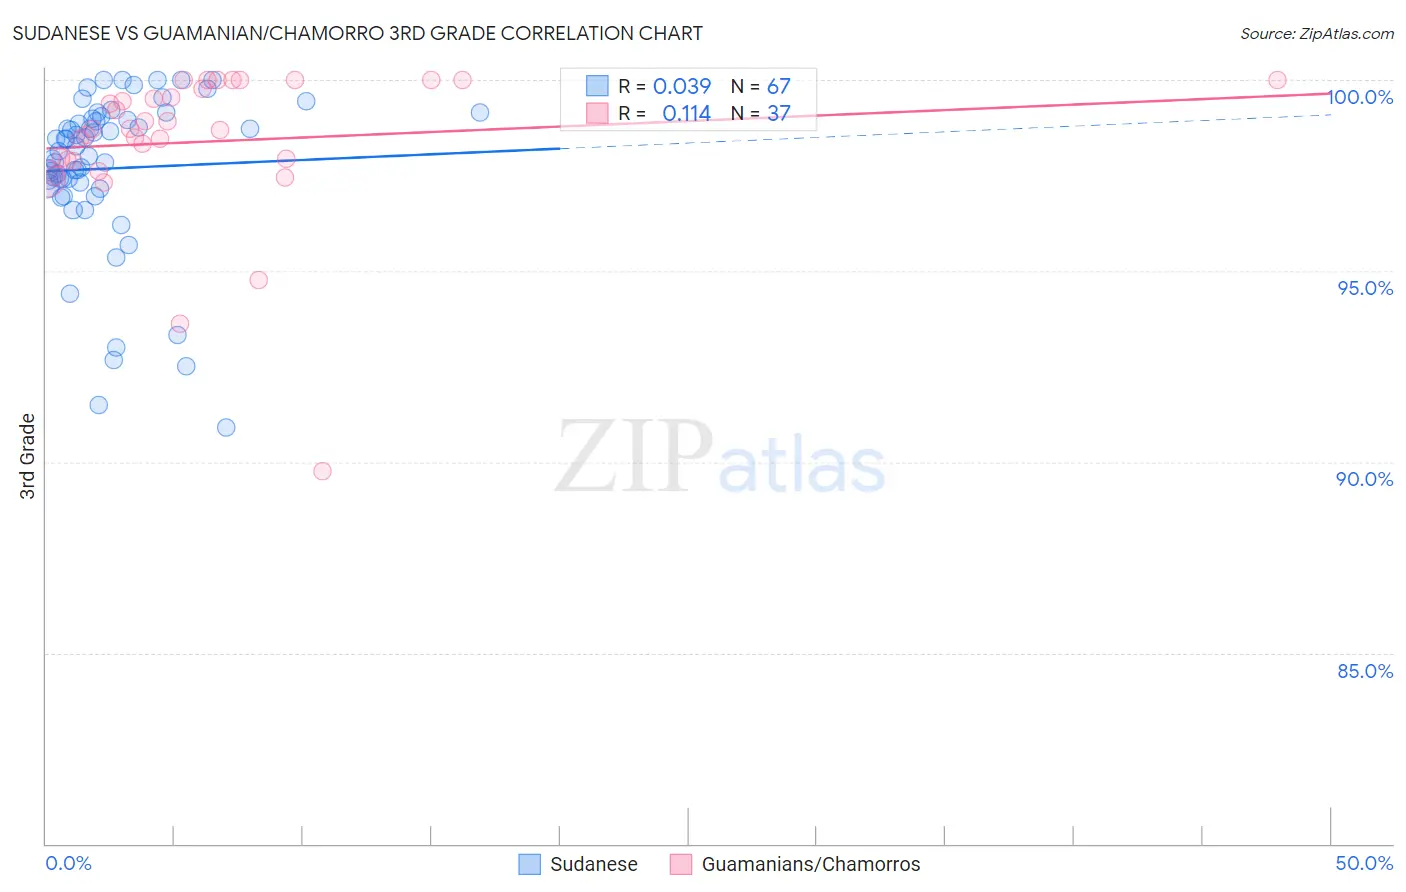
Sudanese vs Guamanian/Chamorro 3rd Grade Correlation Chart
The statistical analysis conducted on geographies consisting of 110,145,984 people shows no correlation between the proportion of Sudanese and percentage of population with at least 3rd grade education in the United States with a correlation coefficient (R) of 0.039 and weighted average of 97.5%. Similarly, the statistical analysis conducted on geographies consisting of 221,965,618 people shows a poor positive correlation between the proportion of Guamanians/Chamorros and percentage of population with at least 3rd grade education in the United States with a correlation coefficient (R) of 0.114 and weighted average of 97.7%, a difference of 0.17%.
3rd Grade Correlation Summary
| Measurement | Sudanese | Guamanian/Chamorro |
| Minimum | 90.9% | 89.7% |
| Maximum | 100.0% | 100.0% |
| Range | 9.1% | 10.3% |
| Mean | 97.7% | 98.4% |
| Median | 98.1% | 98.7% |
| Interquartile 25% (IQ1) | 97.2% | 97.9% |
| Interquartile 75% (IQ3) | 99.0% | 99.9% |
| Interquartile Range (IQR) | 1.8% | 2.0% |
| Standard Deviation (Sample) | 2.1% | 2.0% |
| Standard Deviation (Population) | 2.1% | 2.0% |
Similar Demographics by 3rd Grade
Demographics Similar to Sudanese by 3rd Grade
In terms of 3rd grade, the demographic groups most similar to Sudanese are Tongan (97.5%, a difference of 0.0%), Sierra Leonean (97.5%, a difference of 0.010%), Immigrants from Syria (97.5%, a difference of 0.010%), Bahamian (97.5%, a difference of 0.010%), and Immigrants from Panama (97.5%, a difference of 0.020%).
| Demographics | Rating | Rank | 3rd Grade |
| Immigrants | Panama | 5.2 /100 | #219 | Tragic 97.5% |
| Immigrants | Morocco | 5.0 /100 | #220 | Tragic 97.5% |
| Uruguayans | 5.0 /100 | #221 | Tragic 97.5% |
| Sierra Leoneans | 4.6 /100 | #222 | Tragic 97.5% |
| Immigrants | Syria | 4.4 /100 | #223 | Tragic 97.5% |
| Bahamians | 4.4 /100 | #224 | Tragic 97.5% |
| Tongans | 4.3 /100 | #225 | Tragic 97.5% |
| Sudanese | 4.1 /100 | #226 | Tragic 97.5% |
| Immigrants | Sudan | 3.4 /100 | #227 | Tragic 97.5% |
| Sub-Saharan Africans | 3.2 /100 | #228 | Tragic 97.5% |
| Senegalese | 3.0 /100 | #229 | Tragic 97.5% |
| Immigrants | Pakistan | 2.7 /100 | #230 | Tragic 97.5% |
| Immigrants | Costa Rica | 2.7 /100 | #231 | Tragic 97.5% |
| Immigrants | Western Asia | 2.6 /100 | #232 | Tragic 97.5% |
| Immigrants | Malaysia | 2.4 /100 | #233 | Tragic 97.5% |
Demographics Similar to Guamanians/Chamorros by 3rd Grade
In terms of 3rd grade, the demographic groups most similar to Guamanians/Chamorros are Immigrants from Ukraine (97.7%, a difference of 0.0%), Immigrants from Egypt (97.7%, a difference of 0.010%), Paraguayan (97.7%, a difference of 0.010%), Hawaiian (97.7%, a difference of 0.010%), and Immigrants from Albania (97.7%, a difference of 0.010%).
| Demographics | Rating | Rank | 3rd Grade |
| Blacks/African Americans | 29.6 /100 | #191 | Fair 97.7% |
| Mongolians | 29.1 /100 | #192 | Fair 97.7% |
| Immigrants | Kenya | 28.2 /100 | #193 | Fair 97.7% |
| Immigrants | Uganda | 27.4 /100 | #194 | Fair 97.7% |
| Immigrants | Egypt | 26.8 /100 | #195 | Fair 97.7% |
| Paraguayans | 26.2 /100 | #196 | Fair 97.7% |
| Hawaiians | 25.7 /100 | #197 | Fair 97.7% |
| Guamanians/Chamorros | 23.6 /100 | #198 | Fair 97.7% |
| Immigrants | Ukraine | 22.7 /100 | #199 | Fair 97.7% |
| Immigrants | Albania | 22.6 /100 | #200 | Fair 97.7% |
| Immigrants | Lebanon | 21.7 /100 | #201 | Fair 97.7% |
| Immigrants | Southern Europe | 17.7 /100 | #202 | Poor 97.6% |
| Paiute | 16.7 /100 | #203 | Poor 97.6% |
| Immigrants | Chile | 16.5 /100 | #204 | Poor 97.6% |
| Africans | 14.5 /100 | #205 | Poor 97.6% |