Immigrants from Western Asia vs Choctaw 9th Grade
COMPARE
Immigrants from Western Asia
Choctaw
9th Grade
9th Grade Comparison
Immigrants from Western Asia
Choctaw
94.5%
9TH GRADE
10.7/ 100
METRIC RATING
216th/ 347
METRIC RANK
95.1%
9TH GRADE
81.9/ 100
METRIC RATING
147th/ 347
METRIC RANK
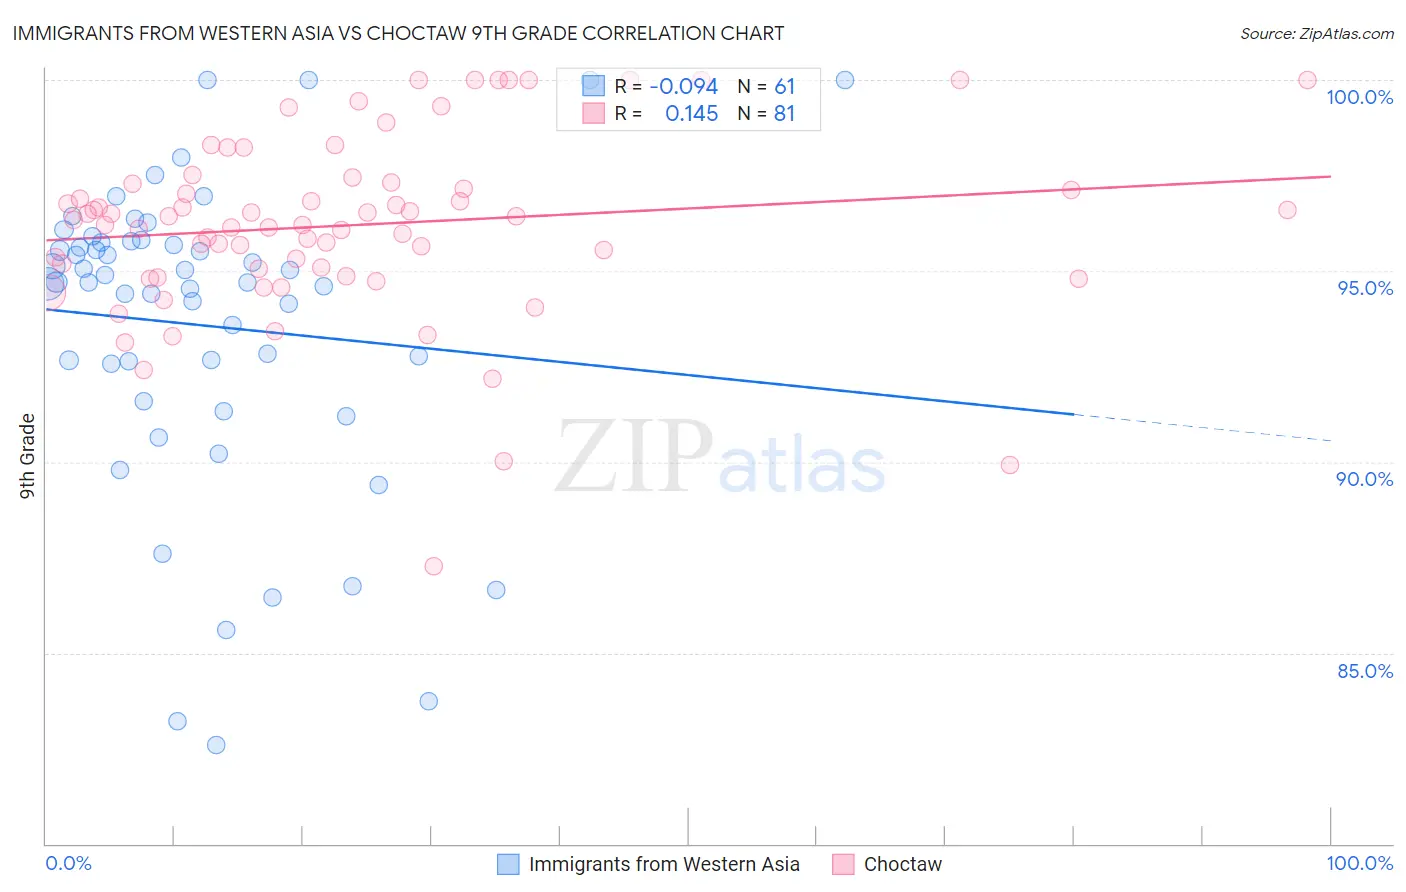
Immigrants from Western Asia vs Choctaw 9th Grade Correlation Chart
The statistical analysis conducted on geographies consisting of 404,433,811 people shows a slight negative correlation between the proportion of Immigrants from Western Asia and percentage of population with at least 9th grade education in the United States with a correlation coefficient (R) of -0.094 and weighted average of 94.5%. Similarly, the statistical analysis conducted on geographies consisting of 269,742,875 people shows a poor positive correlation between the proportion of Choctaw and percentage of population with at least 9th grade education in the United States with a correlation coefficient (R) of 0.145 and weighted average of 95.1%, a difference of 0.67%.
9th Grade Correlation Summary
| Measurement | Immigrants from Western Asia | Choctaw |
| Minimum | 82.6% | 87.3% |
| Maximum | 100.0% | 100.0% |
| Range | 17.4% | 12.7% |
| Mean | 93.6% | 96.2% |
| Median | 94.7% | 96.3% |
| Interquartile 25% (IQ1) | 92.1% | 95.0% |
| Interquartile 75% (IQ3) | 95.8% | 97.3% |
| Interquartile Range (IQR) | 3.7% | 2.3% |
| Standard Deviation (Sample) | 4.0% | 2.4% |
| Standard Deviation (Population) | 4.0% | 2.4% |
Similar Demographics by 9th Grade
Demographics Similar to Immigrants from Western Asia by 9th Grade
In terms of 9th grade, the demographic groups most similar to Immigrants from Western Asia are Immigrants from Syria (94.5%, a difference of 0.010%), Immigrants from Liberia (94.5%, a difference of 0.020%), Asian (94.5%, a difference of 0.020%), Immigrants from Indonesia (94.5%, a difference of 0.030%), and Immigrants from Malaysia (94.5%, a difference of 0.030%).
| Demographics | Rating | Rank | 9th Grade |
| Comanche | 14.9 /100 | #209 | Poor 94.6% |
| Immigrants | Chile | 13.4 /100 | #210 | Poor 94.5% |
| Immigrants | Indonesia | 12.3 /100 | #211 | Poor 94.5% |
| Immigrants | Malaysia | 12.2 /100 | #212 | Poor 94.5% |
| Immigrants | Oceania | 12.1 /100 | #213 | Poor 94.5% |
| Immigrants | Liberia | 11.8 /100 | #214 | Poor 94.5% |
| Immigrants | Syria | 11.0 /100 | #215 | Poor 94.5% |
| Immigrants | Western Asia | 10.7 /100 | #216 | Poor 94.5% |
| Asians | 9.9 /100 | #217 | Tragic 94.5% |
| Portuguese | 9.2 /100 | #218 | Tragic 94.5% |
| Africans | 9.0 /100 | #219 | Tragic 94.5% |
| Indians (Asian) | 8.6 /100 | #220 | Tragic 94.5% |
| Immigrants | Eastern Africa | 8.2 /100 | #221 | Tragic 94.5% |
| Immigrants | Asia | 7.7 /100 | #222 | Tragic 94.4% |
| Bahamians | 7.0 /100 | #223 | Tragic 94.4% |
Demographics Similar to Choctaw by 9th Grade
In terms of 9th grade, the demographic groups most similar to Choctaw are Pueblo (95.1%, a difference of 0.0%), Immigrants from Sri Lanka (95.1%, a difference of 0.0%), Immigrants from Jordan (95.1%, a difference of 0.010%), Yup'ik (95.2%, a difference of 0.020%), and Spanish (95.2%, a difference of 0.030%).
| Demographics | Rating | Rank | 9th Grade |
| Immigrants | Taiwan | 85.3 /100 | #140 | Excellent 95.2% |
| Immigrants | Bosnia and Herzegovina | 85.2 /100 | #141 | Excellent 95.2% |
| Immigrants | Greece | 84.6 /100 | #142 | Excellent 95.2% |
| Spanish | 84.4 /100 | #143 | Excellent 95.2% |
| Yup'ik | 83.3 /100 | #144 | Excellent 95.2% |
| Pueblo | 82.2 /100 | #145 | Excellent 95.1% |
| Immigrants | Sri Lanka | 82.1 /100 | #146 | Excellent 95.1% |
| Choctaw | 81.9 /100 | #147 | Excellent 95.1% |
| Immigrants | Jordan | 81.2 /100 | #148 | Excellent 95.1% |
| Immigrants | Korea | 79.6 /100 | #149 | Good 95.1% |
| Kenyans | 79.1 /100 | #150 | Good 95.1% |
| Cajuns | 77.3 /100 | #151 | Good 95.1% |
| Ugandans | 77.0 /100 | #152 | Good 95.1% |
| Albanians | 76.1 /100 | #153 | Good 95.1% |
| Arabs | 74.9 /100 | #154 | Good 95.1% |