Immigrants from Western Africa vs Costa Rican No Schooling Completed
COMPARE
Immigrants from Western Africa
Costa Rican
No Schooling Completed
No Schooling Completed Comparison
Immigrants from Western Africa
Costa Ricans
2.6%
NO SCHOOLING COMPLETED
0.1/ 100
METRIC RATING
276th/ 347
METRIC RANK
2.2%
NO SCHOOLING COMPLETED
17.1/ 100
METRIC RATING
201st/ 347
METRIC RANK
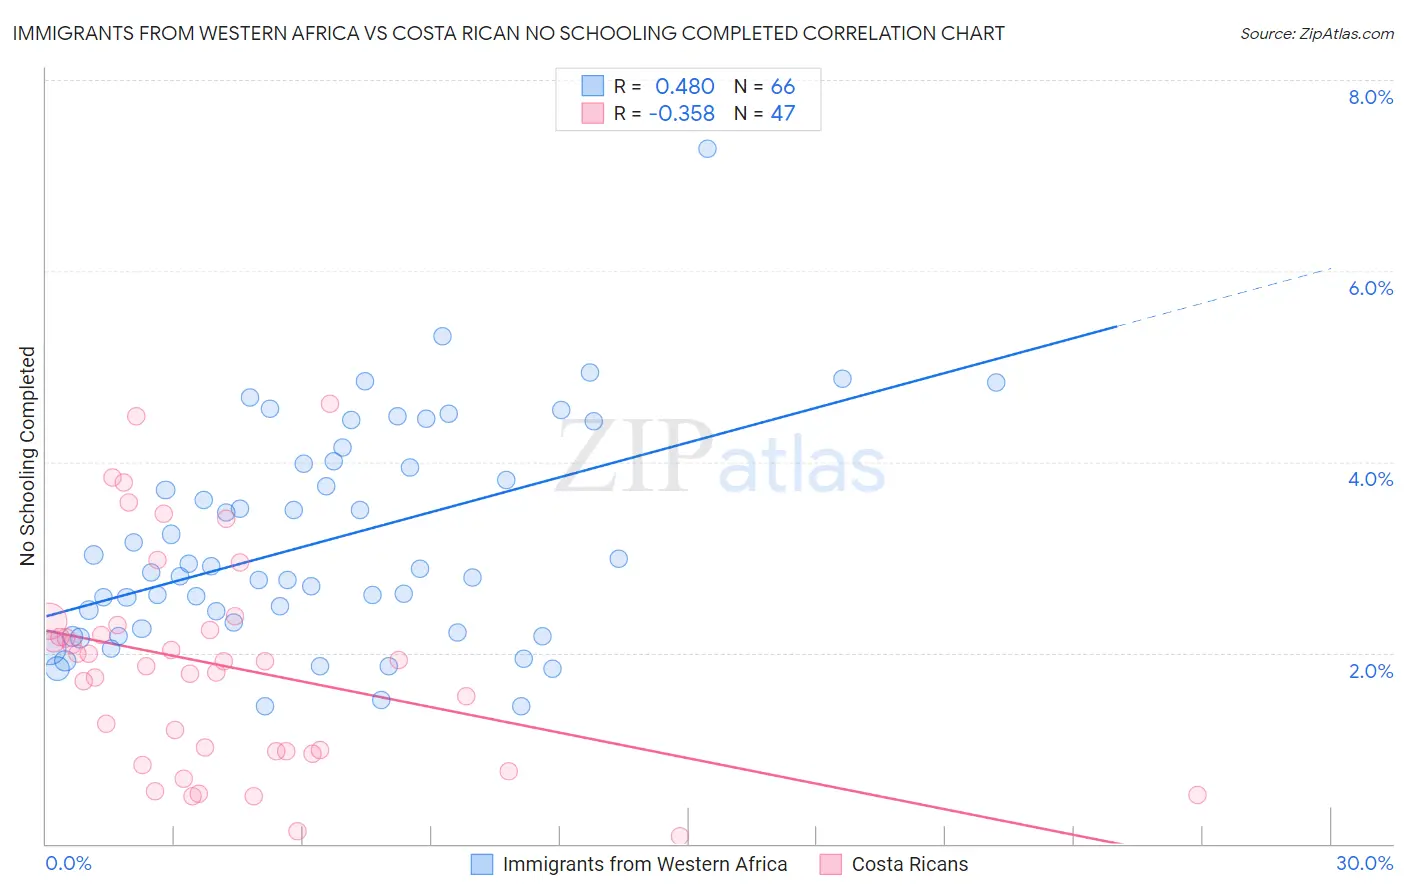
Immigrants from Western Africa vs Costa Rican No Schooling Completed Correlation Chart
The statistical analysis conducted on geographies consisting of 355,413,927 people shows a moderate positive correlation between the proportion of Immigrants from Western Africa and percentage of population with no schooling in the United States with a correlation coefficient (R) of 0.480 and weighted average of 2.6%. Similarly, the statistical analysis conducted on geographies consisting of 252,541,850 people shows a mild negative correlation between the proportion of Costa Ricans and percentage of population with no schooling in the United States with a correlation coefficient (R) of -0.358 and weighted average of 2.2%, a difference of 17.0%.
No Schooling Completed Correlation Summary
| Measurement | Immigrants from Western Africa | Costa Rican |
| Minimum | 1.4% | 0.080% |
| Maximum | 7.3% | 4.6% |
| Range | 5.8% | 4.5% |
| Mean | 3.2% | 1.9% |
| Median | 2.9% | 1.9% |
| Interquartile 25% (IQ1) | 2.3% | 0.97% |
| Interquartile 75% (IQ3) | 4.0% | 2.3% |
| Interquartile Range (IQR) | 1.7% | 1.3% |
| Standard Deviation (Sample) | 1.1% | 1.1% |
| Standard Deviation (Population) | 1.1% | 1.1% |
Similar Demographics by No Schooling Completed
Demographics Similar to Immigrants from Western Africa by No Schooling Completed
In terms of no schooling completed, the demographic groups most similar to Immigrants from Western Africa are Immigrants from Philippines (2.6%, a difference of 0.050%), Immigrants from Uzbekistan (2.6%, a difference of 0.25%), Immigrants from China (2.6%, a difference of 0.56%), Ghanaian (2.6%, a difference of 0.74%), and Barbadian (2.6%, a difference of 0.80%).
| Demographics | Rating | Rank | No Schooling Completed |
| Immigrants | Nigeria | 0.2 /100 | #269 | Tragic 2.5% |
| Immigrants | Peru | 0.2 /100 | #270 | Tragic 2.5% |
| Cubans | 0.2 /100 | #271 | Tragic 2.5% |
| Immigrants | Bolivia | 0.2 /100 | #272 | Tragic 2.5% |
| Immigrants | Cameroon | 0.1 /100 | #273 | Tragic 2.5% |
| Ghanaians | 0.1 /100 | #274 | Tragic 2.6% |
| Immigrants | China | 0.1 /100 | #275 | Tragic 2.6% |
| Immigrants | Western Africa | 0.1 /100 | #276 | Tragic 2.6% |
| Immigrants | Philippines | 0.1 /100 | #277 | Tragic 2.6% |
| Immigrants | Uzbekistan | 0.1 /100 | #278 | Tragic 2.6% |
| Barbadians | 0.1 /100 | #279 | Tragic 2.6% |
| Trinidadians and Tobagonians | 0.1 /100 | #280 | Tragic 2.6% |
| Afghans | 0.1 /100 | #281 | Tragic 2.6% |
| Immigrants | Ghana | 0.1 /100 | #282 | Tragic 2.6% |
| Immigrants | Trinidad and Tobago | 0.0 /100 | #283 | Tragic 2.6% |
Demographics Similar to Costa Ricans by No Schooling Completed
In terms of no schooling completed, the demographic groups most similar to Costa Ricans are Immigrants from Northern Africa (2.2%, a difference of 0.52%), Moroccan (2.2%, a difference of 0.82%), Laotian (2.2%, a difference of 0.93%), African (2.2%, a difference of 0.98%), and Hopi (2.2%, a difference of 1.0%).
| Demographics | Rating | Rank | No Schooling Completed |
| Immigrants | Albania | 28.3 /100 | #194 | Fair 2.2% |
| Hawaiians | 27.0 /100 | #195 | Fair 2.2% |
| Immigrants | Ukraine | 26.1 /100 | #196 | Fair 2.2% |
| Immigrants | Southern Europe | 23.8 /100 | #197 | Fair 2.2% |
| Immigrants | Chile | 22.7 /100 | #198 | Fair 2.2% |
| Africans | 21.8 /100 | #199 | Fair 2.2% |
| Immigrants | Northern Africa | 19.5 /100 | #200 | Poor 2.2% |
| Costa Ricans | 17.1 /100 | #201 | Poor 2.2% |
| Moroccans | 13.7 /100 | #202 | Poor 2.2% |
| Laotians | 13.3 /100 | #203 | Poor 2.2% |
| Hopi | 12.9 /100 | #204 | Poor 2.2% |
| Immigrants | Bahamas | 11.6 /100 | #205 | Poor 2.2% |
| Bahamians | 11.6 /100 | #206 | Poor 2.2% |
| South American Indians | 11.0 /100 | #207 | Poor 2.2% |
| Uruguayans | 11.0 /100 | #208 | Poor 2.2% |