Immigrants from Western Africa vs Immigrants from Singapore No Schooling Completed
COMPARE
Immigrants from Western Africa
Immigrants from Singapore
No Schooling Completed
No Schooling Completed Comparison
Immigrants from Western Africa
Immigrants from Singapore
2.6%
NO SCHOOLING COMPLETED
0.1/ 100
METRIC RATING
276th/ 347
METRIC RANK
1.8%
NO SCHOOLING COMPLETED
98.0/ 100
METRIC RATING
100th/ 347
METRIC RANK
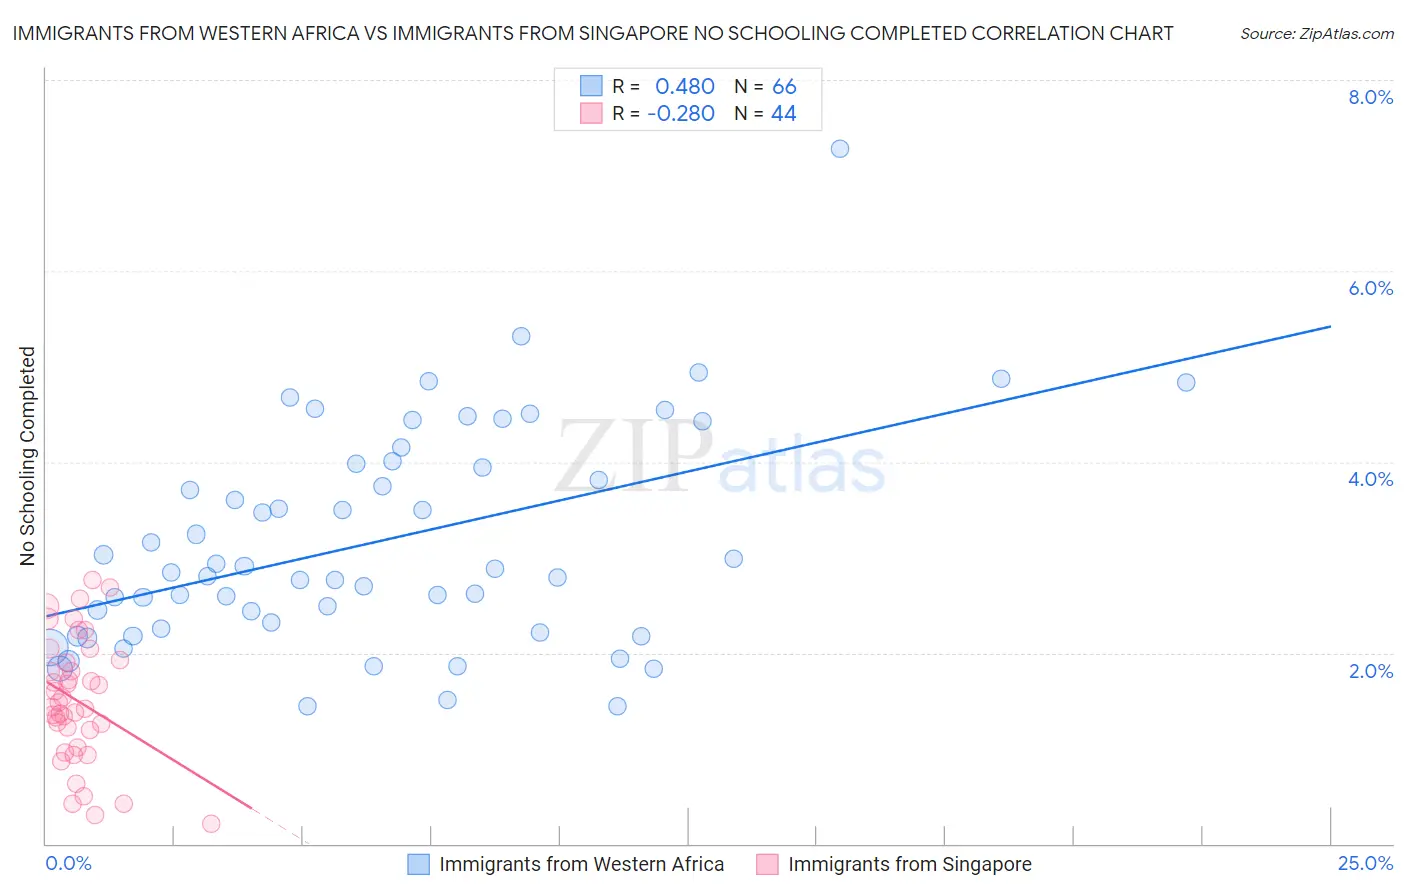
Immigrants from Western Africa vs Immigrants from Singapore No Schooling Completed Correlation Chart
The statistical analysis conducted on geographies consisting of 355,413,927 people shows a moderate positive correlation between the proportion of Immigrants from Western Africa and percentage of population with no schooling in the United States with a correlation coefficient (R) of 0.480 and weighted average of 2.6%. Similarly, the statistical analysis conducted on geographies consisting of 136,992,443 people shows a weak negative correlation between the proportion of Immigrants from Singapore and percentage of population with no schooling in the United States with a correlation coefficient (R) of -0.280 and weighted average of 1.8%, a difference of 41.9%.
No Schooling Completed Correlation Summary
| Measurement | Immigrants from Western Africa | Immigrants from Singapore |
| Minimum | 1.4% | 0.21% |
| Maximum | 7.3% | 2.8% |
| Range | 5.8% | 2.6% |
| Mean | 3.2% | 1.5% |
| Median | 2.9% | 1.5% |
| Interquartile 25% (IQ1) | 2.3% | 1.1% |
| Interquartile 75% (IQ3) | 4.0% | 1.9% |
| Interquartile Range (IQR) | 1.7% | 0.82% |
| Standard Deviation (Sample) | 1.1% | 0.65% |
| Standard Deviation (Population) | 1.1% | 0.64% |
Similar Demographics by No Schooling Completed
Demographics Similar to Immigrants from Western Africa by No Schooling Completed
In terms of no schooling completed, the demographic groups most similar to Immigrants from Western Africa are Immigrants from Philippines (2.6%, a difference of 0.050%), Immigrants from Uzbekistan (2.6%, a difference of 0.25%), Immigrants from China (2.6%, a difference of 0.56%), Ghanaian (2.6%, a difference of 0.74%), and Barbadian (2.6%, a difference of 0.80%).
| Demographics | Rating | Rank | No Schooling Completed |
| Immigrants | Nigeria | 0.2 /100 | #269 | Tragic 2.5% |
| Immigrants | Peru | 0.2 /100 | #270 | Tragic 2.5% |
| Cubans | 0.2 /100 | #271 | Tragic 2.5% |
| Immigrants | Bolivia | 0.2 /100 | #272 | Tragic 2.5% |
| Immigrants | Cameroon | 0.1 /100 | #273 | Tragic 2.5% |
| Ghanaians | 0.1 /100 | #274 | Tragic 2.6% |
| Immigrants | China | 0.1 /100 | #275 | Tragic 2.6% |
| Immigrants | Western Africa | 0.1 /100 | #276 | Tragic 2.6% |
| Immigrants | Philippines | 0.1 /100 | #277 | Tragic 2.6% |
| Immigrants | Uzbekistan | 0.1 /100 | #278 | Tragic 2.6% |
| Barbadians | 0.1 /100 | #279 | Tragic 2.6% |
| Trinidadians and Tobagonians | 0.1 /100 | #280 | Tragic 2.6% |
| Afghans | 0.1 /100 | #281 | Tragic 2.6% |
| Immigrants | Ghana | 0.1 /100 | #282 | Tragic 2.6% |
| Immigrants | Trinidad and Tobago | 0.0 /100 | #283 | Tragic 2.6% |
Demographics Similar to Immigrants from Singapore by No Schooling Completed
In terms of no schooling completed, the demographic groups most similar to Immigrants from Singapore are Choctaw (1.8%, a difference of 0.20%), Immigrants from Czechoslovakia (1.8%, a difference of 0.30%), Immigrants from Switzerland (1.8%, a difference of 0.30%), Basque (1.8%, a difference of 0.35%), and Iranian (1.8%, a difference of 0.39%).
| Demographics | Rating | Rank | No Schooling Completed |
| Turks | 98.7 /100 | #93 | Exceptional 1.8% |
| Immigrants | Nonimmigrants | 98.5 /100 | #94 | Exceptional 1.8% |
| Puget Sound Salish | 98.5 /100 | #95 | Exceptional 1.8% |
| Bhutanese | 98.4 /100 | #96 | Exceptional 1.8% |
| Immigrants | Ireland | 98.4 /100 | #97 | Exceptional 1.8% |
| Iranians | 98.2 /100 | #98 | Exceptional 1.8% |
| Choctaw | 98.1 /100 | #99 | Exceptional 1.8% |
| Immigrants | Singapore | 98.0 /100 | #100 | Exceptional 1.8% |
| Immigrants | Czechoslovakia | 97.9 /100 | #101 | Exceptional 1.8% |
| Immigrants | Switzerland | 97.9 /100 | #102 | Exceptional 1.8% |
| Basques | 97.9 /100 | #103 | Exceptional 1.8% |
| Thais | 97.5 /100 | #104 | Exceptional 1.8% |
| German Russians | 97.5 /100 | #105 | Exceptional 1.8% |
| Immigrants | France | 97.3 /100 | #106 | Exceptional 1.8% |
| Yugoslavians | 97.2 /100 | #107 | Exceptional 1.8% |