Immigrants from Norway vs Immigrants from Singapore No Schooling Completed
COMPARE
Immigrants from Norway
Immigrants from Singapore
No Schooling Completed
No Schooling Completed Comparison
Immigrants from Norway
Immigrants from Singapore
1.9%
NO SCHOOLING COMPLETED
96.1/ 100
METRIC RATING
114th/ 347
METRIC RANK
1.8%
NO SCHOOLING COMPLETED
98.0/ 100
METRIC RATING
100th/ 347
METRIC RANK
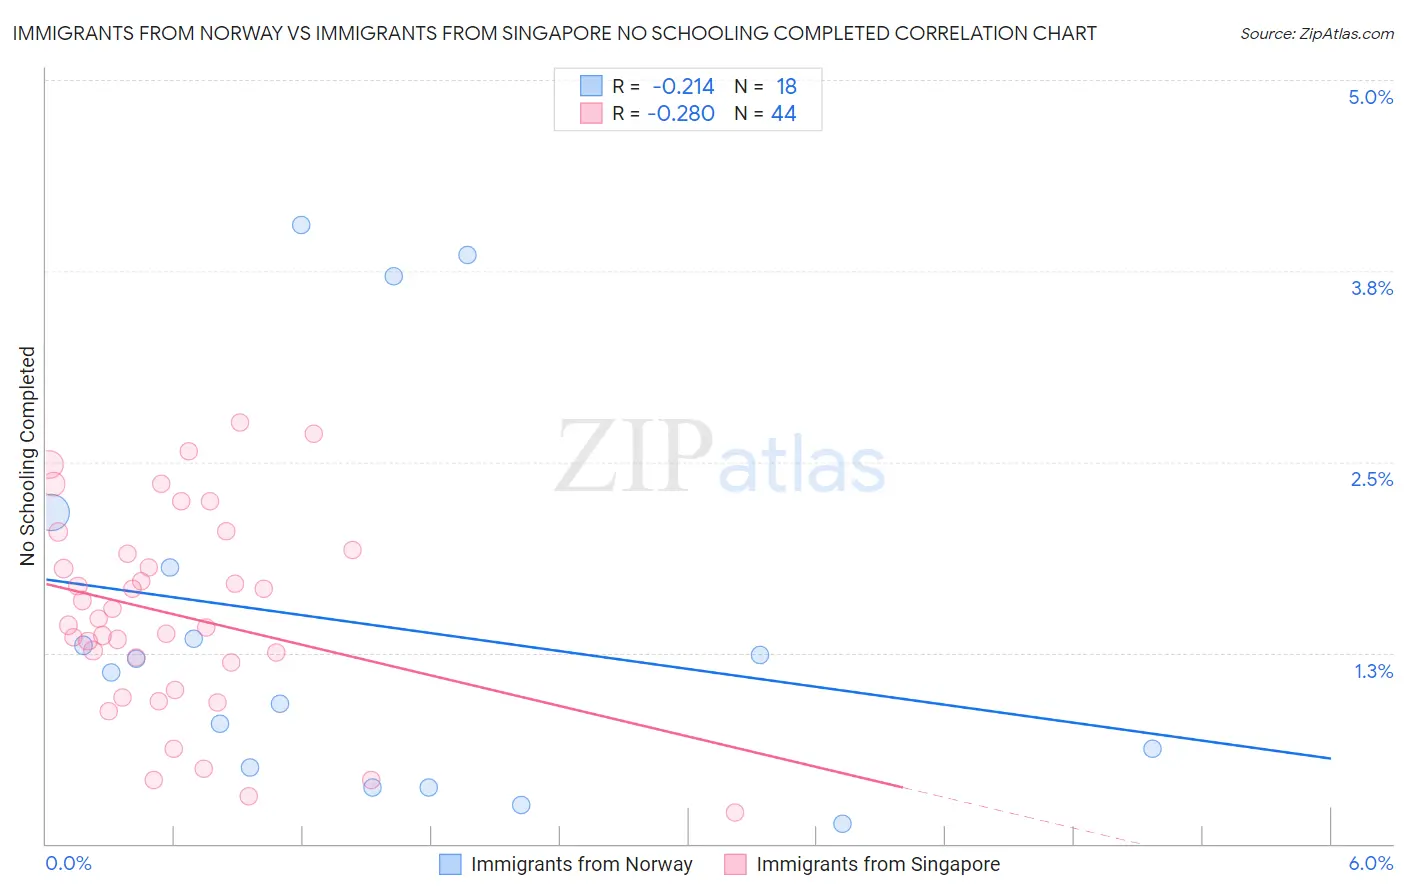
Immigrants from Norway vs Immigrants from Singapore No Schooling Completed Correlation Chart
The statistical analysis conducted on geographies consisting of 116,062,009 people shows a weak negative correlation between the proportion of Immigrants from Norway and percentage of population with no schooling in the United States with a correlation coefficient (R) of -0.214 and weighted average of 1.9%. Similarly, the statistical analysis conducted on geographies consisting of 136,992,443 people shows a weak negative correlation between the proportion of Immigrants from Singapore and percentage of population with no schooling in the United States with a correlation coefficient (R) of -0.280 and weighted average of 1.8%, a difference of 2.7%.
No Schooling Completed Correlation Summary
| Measurement | Immigrants from Norway | Immigrants from Singapore |
| Minimum | 0.13% | 0.21% |
| Maximum | 4.0% | 2.8% |
| Range | 3.9% | 2.6% |
| Mean | 1.4% | 1.5% |
| Median | 1.2% | 1.5% |
| Interquartile 25% (IQ1) | 0.50% | 1.1% |
| Interquartile 75% (IQ3) | 1.8% | 1.9% |
| Interquartile Range (IQR) | 1.3% | 0.82% |
| Standard Deviation (Sample) | 1.2% | 0.65% |
| Standard Deviation (Population) | 1.2% | 0.64% |
Demographics Similar to Immigrants from Norway and Immigrants from Singapore by No Schooling Completed
In terms of no schooling completed, the demographic groups most similar to Immigrants from Norway are Immigrants from Zimbabwe (1.9%, a difference of 0.010%), Syrian (1.9%, a difference of 0.13%), Lebanese (1.9%, a difference of 0.15%), Pueblo (1.9%, a difference of 0.25%), and Immigrants from Serbia (1.9%, a difference of 0.35%). Similarly, the demographic groups most similar to Immigrants from Singapore are Choctaw (1.8%, a difference of 0.20%), Immigrants from Czechoslovakia (1.8%, a difference of 0.30%), Immigrants from Switzerland (1.8%, a difference of 0.30%), Basque (1.8%, a difference of 0.35%), and Iranian (1.8%, a difference of 0.39%).
| Demographics | Rating | Rank | No Schooling Completed |
| Immigrants | Ireland | 98.4 /100 | #97 | Exceptional 1.8% |
| Iranians | 98.2 /100 | #98 | Exceptional 1.8% |
| Choctaw | 98.1 /100 | #99 | Exceptional 1.8% |
| Immigrants | Singapore | 98.0 /100 | #100 | Exceptional 1.8% |
| Immigrants | Czechoslovakia | 97.9 /100 | #101 | Exceptional 1.8% |
| Immigrants | Switzerland | 97.9 /100 | #102 | Exceptional 1.8% |
| Basques | 97.9 /100 | #103 | Exceptional 1.8% |
| Thais | 97.5 /100 | #104 | Exceptional 1.8% |
| German Russians | 97.5 /100 | #105 | Exceptional 1.8% |
| Immigrants | France | 97.3 /100 | #106 | Exceptional 1.8% |
| Yugoslavians | 97.2 /100 | #107 | Exceptional 1.8% |
| Okinawans | 97.1 /100 | #108 | Exceptional 1.8% |
| Immigrants | Saudi Arabia | 96.8 /100 | #109 | Exceptional 1.9% |
| Immigrants | Latvia | 96.7 /100 | #110 | Exceptional 1.9% |
| Immigrants | Japan | 96.6 /100 | #111 | Exceptional 1.9% |
| Pueblo | 96.4 /100 | #112 | Exceptional 1.9% |
| Immigrants | Zimbabwe | 96.2 /100 | #113 | Exceptional 1.9% |
| Immigrants | Norway | 96.1 /100 | #114 | Exceptional 1.9% |
| Syrians | 96.0 /100 | #115 | Exceptional 1.9% |
| Lebanese | 96.0 /100 | #116 | Exceptional 1.9% |
| Immigrants | Serbia | 95.8 /100 | #117 | Exceptional 1.9% |