Immigrants from Sri Lanka vs Immigrants from Singapore No Schooling Completed
COMPARE
Immigrants from Sri Lanka
Immigrants from Singapore
No Schooling Completed
No Schooling Completed Comparison
Immigrants from Sri Lanka
Immigrants from Singapore
2.0%
NO SCHOOLING COMPLETED
67.0/ 100
METRIC RATING
157th/ 347
METRIC RANK
1.8%
NO SCHOOLING COMPLETED
98.0/ 100
METRIC RATING
100th/ 347
METRIC RANK
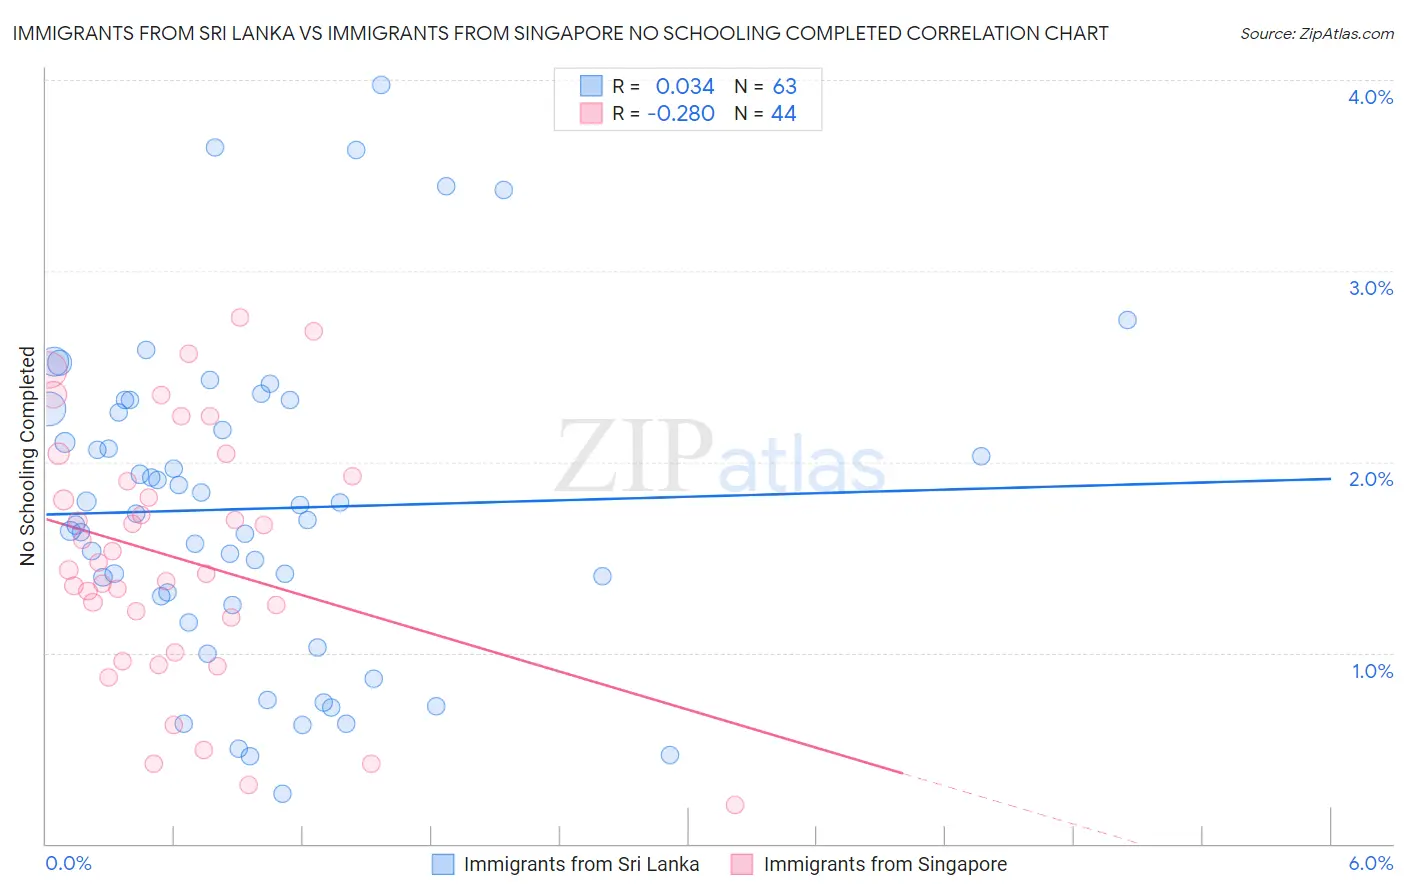
Immigrants from Sri Lanka vs Immigrants from Singapore No Schooling Completed Correlation Chart
The statistical analysis conducted on geographies consisting of 149,315,237 people shows no correlation between the proportion of Immigrants from Sri Lanka and percentage of population with no schooling in the United States with a correlation coefficient (R) of 0.034 and weighted average of 2.0%. Similarly, the statistical analysis conducted on geographies consisting of 136,992,443 people shows a weak negative correlation between the proportion of Immigrants from Singapore and percentage of population with no schooling in the United States with a correlation coefficient (R) of -0.280 and weighted average of 1.8%, a difference of 12.4%.
No Schooling Completed Correlation Summary
| Measurement | Immigrants from Sri Lanka | Immigrants from Singapore |
| Minimum | 0.26% | 0.21% |
| Maximum | 4.0% | 2.8% |
| Range | 3.7% | 2.6% |
| Mean | 1.8% | 1.5% |
| Median | 1.7% | 1.5% |
| Interquartile 25% (IQ1) | 1.2% | 1.1% |
| Interquartile 75% (IQ3) | 2.3% | 1.9% |
| Interquartile Range (IQR) | 1.0% | 0.82% |
| Standard Deviation (Sample) | 0.83% | 0.65% |
| Standard Deviation (Population) | 0.82% | 0.64% |
Similar Demographics by No Schooling Completed
Demographics Similar to Immigrants from Sri Lanka by No Schooling Completed
In terms of no schooling completed, the demographic groups most similar to Immigrants from Sri Lanka are Chilean (2.0%, a difference of 0.030%), Immigrants from Korea (2.0%, a difference of 0.040%), Immigrants from Spain (2.0%, a difference of 0.090%), Immigrants from Russia (2.0%, a difference of 0.10%), and Kenyan (2.0%, a difference of 0.20%).
| Demographics | Rating | Rank | No Schooling Completed |
| Blackfeet | 72.9 /100 | #150 | Good 2.0% |
| Immigrants | Jordan | 70.9 /100 | #151 | Good 2.0% |
| Immigrants | Eastern Europe | 70.4 /100 | #152 | Good 2.0% |
| Immigrants | Italy | 68.9 /100 | #153 | Good 2.0% |
| Immigrants | Venezuela | 68.5 /100 | #154 | Good 2.0% |
| Immigrants | Russia | 67.6 /100 | #155 | Good 2.0% |
| Chileans | 67.2 /100 | #156 | Good 2.0% |
| Immigrants | Sri Lanka | 67.0 /100 | #157 | Good 2.0% |
| Immigrants | Korea | 66.7 /100 | #158 | Good 2.0% |
| Immigrants | Spain | 66.4 /100 | #159 | Good 2.0% |
| Kenyans | 65.7 /100 | #160 | Good 2.0% |
| Ugandans | 64.6 /100 | #161 | Good 2.0% |
| Immigrants | Brazil | 63.8 /100 | #162 | Good 2.1% |
| Albanians | 62.2 /100 | #163 | Good 2.1% |
| Comanche | 60.7 /100 | #164 | Good 2.1% |
Demographics Similar to Immigrants from Singapore by No Schooling Completed
In terms of no schooling completed, the demographic groups most similar to Immigrants from Singapore are Choctaw (1.8%, a difference of 0.20%), Immigrants from Czechoslovakia (1.8%, a difference of 0.30%), Immigrants from Switzerland (1.8%, a difference of 0.30%), Basque (1.8%, a difference of 0.35%), and Iranian (1.8%, a difference of 0.39%).
| Demographics | Rating | Rank | No Schooling Completed |
| Turks | 98.7 /100 | #93 | Exceptional 1.8% |
| Immigrants | Nonimmigrants | 98.5 /100 | #94 | Exceptional 1.8% |
| Puget Sound Salish | 98.5 /100 | #95 | Exceptional 1.8% |
| Bhutanese | 98.4 /100 | #96 | Exceptional 1.8% |
| Immigrants | Ireland | 98.4 /100 | #97 | Exceptional 1.8% |
| Iranians | 98.2 /100 | #98 | Exceptional 1.8% |
| Choctaw | 98.1 /100 | #99 | Exceptional 1.8% |
| Immigrants | Singapore | 98.0 /100 | #100 | Exceptional 1.8% |
| Immigrants | Czechoslovakia | 97.9 /100 | #101 | Exceptional 1.8% |
| Immigrants | Switzerland | 97.9 /100 | #102 | Exceptional 1.8% |
| Basques | 97.9 /100 | #103 | Exceptional 1.8% |
| Thais | 97.5 /100 | #104 | Exceptional 1.8% |
| German Russians | 97.5 /100 | #105 | Exceptional 1.8% |
| Immigrants | France | 97.3 /100 | #106 | Exceptional 1.8% |
| Yugoslavians | 97.2 /100 | #107 | Exceptional 1.8% |