Immigrants from Western Africa vs Immigrants from Nepal Unemployment Among Ages 30 to 34 years
COMPARE
Immigrants from Western Africa
Immigrants from Nepal
Unemployment Among Ages 30 to 34 years
Unemployment Among Ages 30 to 34 years Comparison
Immigrants from Western Africa
Immigrants from Nepal
6.2%
UNEMPLOYMENT AMONG AGES 30 TO 34 YEARS
0.1/ 100
METRIC RATING
261st/ 347
METRIC RANK
4.7%
UNEMPLOYMENT AMONG AGES 30 TO 34 YEARS
100.0/ 100
METRIC RATING
4th/ 347
METRIC RANK
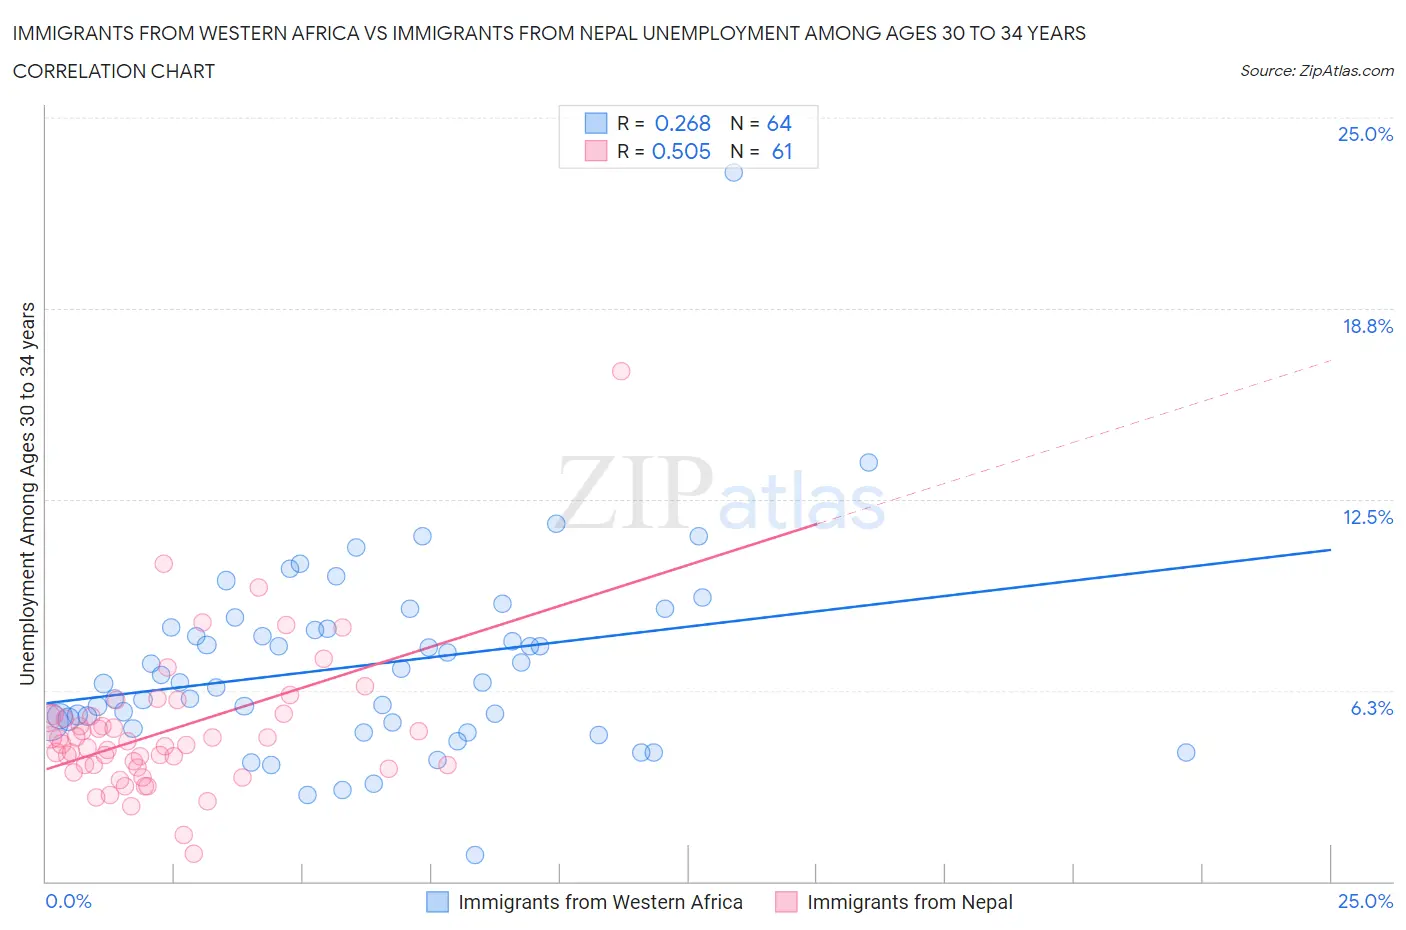
Immigrants from Western Africa vs Immigrants from Nepal Unemployment Among Ages 30 to 34 years Correlation Chart
The statistical analysis conducted on geographies consisting of 343,226,185 people shows a weak positive correlation between the proportion of Immigrants from Western Africa and unemployment rate among population between the ages 30 and 34 in the United States with a correlation coefficient (R) of 0.268 and weighted average of 6.2%. Similarly, the statistical analysis conducted on geographies consisting of 182,258,798 people shows a substantial positive correlation between the proportion of Immigrants from Nepal and unemployment rate among population between the ages 30 and 34 in the United States with a correlation coefficient (R) of 0.505 and weighted average of 4.7%, a difference of 31.8%.
Unemployment Among Ages 30 to 34 years Correlation Summary
| Measurement | Immigrants from Western Africa | Immigrants from Nepal |
| Minimum | 0.84% | 0.90% |
| Maximum | 23.2% | 16.7% |
| Range | 22.4% | 15.8% |
| Mean | 7.1% | 4.9% |
| Median | 6.5% | 4.5% |
| Interquartile 25% (IQ1) | 5.2% | 3.8% |
| Interquartile 75% (IQ3) | 8.3% | 5.4% |
| Interquartile Range (IQR) | 3.1% | 1.7% |
| Standard Deviation (Sample) | 3.2% | 2.3% |
| Standard Deviation (Population) | 3.2% | 2.3% |
Similar Demographics by Unemployment Among Ages 30 to 34 years
Demographics Similar to Immigrants from Western Africa by Unemployment Among Ages 30 to 34 years
In terms of unemployment among ages 30 to 34 years, the demographic groups most similar to Immigrants from Western Africa are Immigrants from Latin America (6.1%, a difference of 0.15%), Immigrants from Central America (6.2%, a difference of 0.18%), Haitian (6.1%, a difference of 0.36%), Mexican (6.1%, a difference of 0.44%), and Immigrants from Sierra Leone (6.1%, a difference of 0.51%).
| Demographics | Rating | Rank | Unemployment Among Ages 30 to 34 years |
| Armenians | 0.1 /100 | #254 | Tragic 6.1% |
| Immigrants | Portugal | 0.1 /100 | #255 | Tragic 6.1% |
| Immigrants | Ghana | 0.1 /100 | #256 | Tragic 6.1% |
| Immigrants | Sierra Leone | 0.1 /100 | #257 | Tragic 6.1% |
| Mexicans | 0.1 /100 | #258 | Tragic 6.1% |
| Haitians | 0.1 /100 | #259 | Tragic 6.1% |
| Immigrants | Latin America | 0.1 /100 | #260 | Tragic 6.1% |
| Immigrants | Western Africa | 0.1 /100 | #261 | Tragic 6.2% |
| Immigrants | Central America | 0.1 /100 | #262 | Tragic 6.2% |
| Spanish Americans | 0.0 /100 | #263 | Tragic 6.2% |
| Chickasaw | 0.0 /100 | #264 | Tragic 6.2% |
| Americans | 0.0 /100 | #265 | Tragic 6.2% |
| Seminole | 0.0 /100 | #266 | Tragic 6.2% |
| Immigrants | Mexico | 0.0 /100 | #267 | Tragic 6.2% |
| Immigrants | Haiti | 0.0 /100 | #268 | Tragic 6.2% |
Demographics Similar to Immigrants from Nepal by Unemployment Among Ages 30 to 34 years
In terms of unemployment among ages 30 to 34 years, the demographic groups most similar to Immigrants from Nepal are Venezuelan (4.7%, a difference of 0.64%), Immigrants from Venezuela (4.6%, a difference of 0.67%), Immigrants from Bosnia and Herzegovina (4.7%, a difference of 0.87%), Thai (4.7%, a difference of 1.1%), and Immigrants from Eritrea (4.7%, a difference of 1.3%).
| Demographics | Rating | Rank | Unemployment Among Ages 30 to 34 years |
| Immigrants | India | 100.0 /100 | #1 | Exceptional 4.5% |
| Sudanese | 100.0 /100 | #2 | Exceptional 4.6% |
| Immigrants | Venezuela | 100.0 /100 | #3 | Exceptional 4.6% |
| Immigrants | Nepal | 100.0 /100 | #4 | Exceptional 4.7% |
| Venezuelans | 100.0 /100 | #5 | Exceptional 4.7% |
| Immigrants | Bosnia and Herzegovina | 100.0 /100 | #6 | Exceptional 4.7% |
| Thais | 100.0 /100 | #7 | Exceptional 4.7% |
| Immigrants | Eritrea | 100.0 /100 | #8 | Exceptional 4.7% |
| Bulgarians | 99.9 /100 | #9 | Exceptional 4.7% |
| Tongans | 99.9 /100 | #10 | Exceptional 4.8% |
| Immigrants | Bolivia | 99.9 /100 | #11 | Exceptional 4.8% |
| Filipinos | 99.9 /100 | #12 | Exceptional 4.8% |
| Cambodians | 99.9 /100 | #13 | Exceptional 4.8% |
| Luxembourgers | 99.9 /100 | #14 | Exceptional 4.8% |
| Okinawans | 99.9 /100 | #15 | Exceptional 4.8% |