Immigrants from Western Europe vs Yakama Doctorate Degree
COMPARE
Immigrants from Western Europe
Yakama
Doctorate Degree
Doctorate Degree Comparison
Immigrants from Western Europe
Yakama
2.4%
DOCTORATE DEGREE
100.0/ 100
METRIC RATING
47th/ 347
METRIC RANK
1.3%
DOCTORATE DEGREE
0.0/ 100
METRIC RATING
332nd/ 347
METRIC RANK
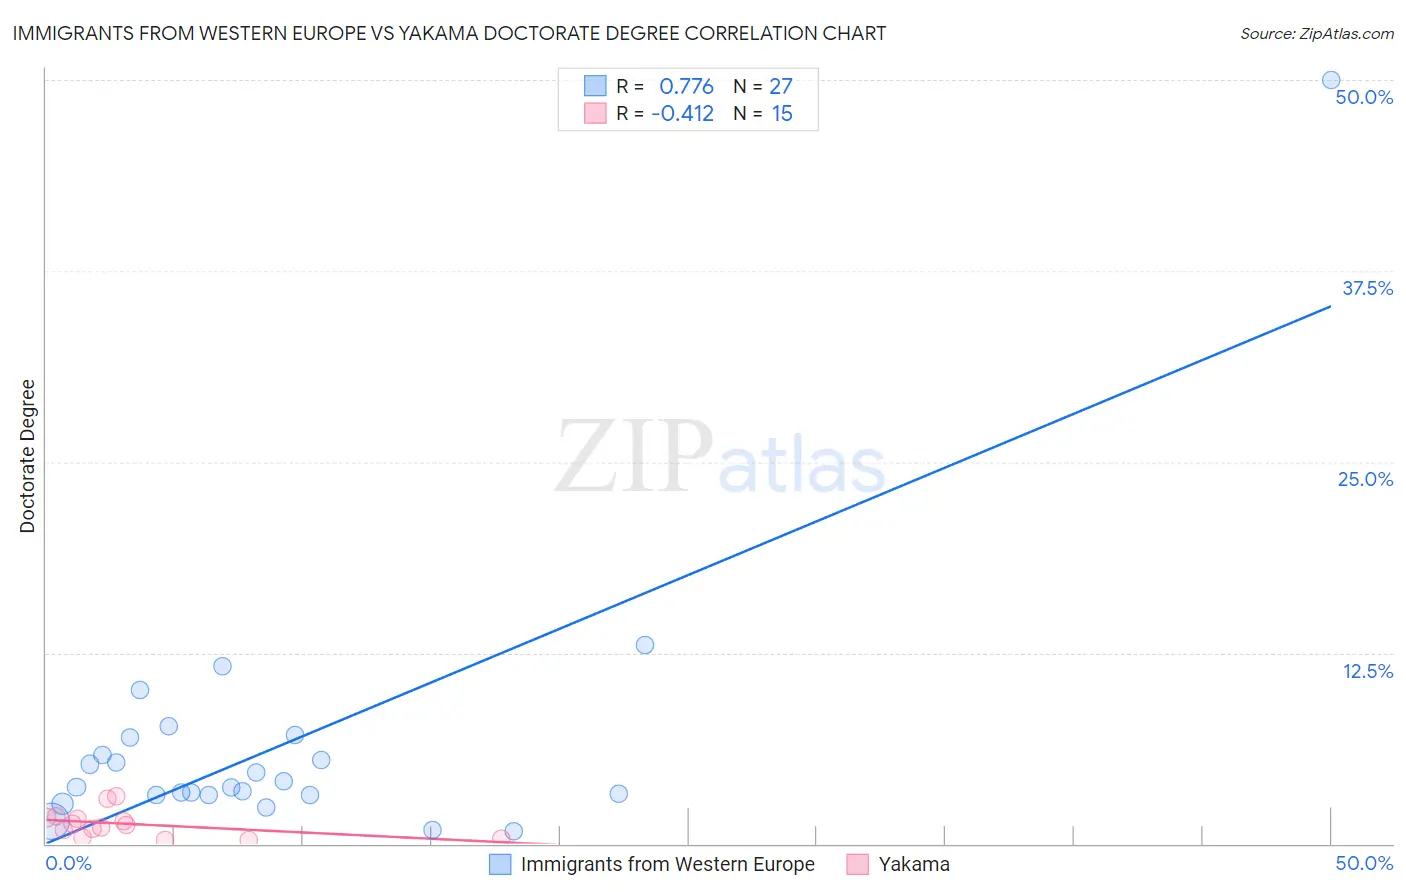
Immigrants from Western Europe vs Yakama Doctorate Degree Correlation Chart
The statistical analysis conducted on geographies consisting of 485,772,284 people shows a strong positive correlation between the proportion of Immigrants from Western Europe and percentage of population with at least doctorate degree education in the United States with a correlation coefficient (R) of 0.776 and weighted average of 2.4%. Similarly, the statistical analysis conducted on geographies consisting of 19,742,770 people shows a moderate negative correlation between the proportion of Yakama and percentage of population with at least doctorate degree education in the United States with a correlation coefficient (R) of -0.412 and weighted average of 1.3%, a difference of 89.7%.
Doctorate Degree Correlation Summary
| Measurement | Immigrants from Western Europe | Yakama |
| Minimum | 0.81% | 0.27% |
| Maximum | 50.0% | 3.1% |
| Range | 49.2% | 2.9% |
| Mean | 6.5% | 1.3% |
| Median | 3.7% | 1.2% |
| Interquartile 25% (IQ1) | 3.2% | 0.37% |
| Interquartile 75% (IQ3) | 7.0% | 1.7% |
| Interquartile Range (IQR) | 3.8% | 1.3% |
| Standard Deviation (Sample) | 9.2% | 0.89% |
| Standard Deviation (Population) | 9.0% | 0.86% |
Similar Demographics by Doctorate Degree
Demographics Similar to Immigrants from Western Europe by Doctorate Degree
In terms of doctorate degree, the demographic groups most similar to Immigrants from Western Europe are Asian (2.4%, a difference of 0.21%), Immigrants from Austria (2.4%, a difference of 0.22%), Immigrants from Asia (2.4%, a difference of 0.34%), Immigrants from South Africa (2.4%, a difference of 0.36%), and Immigrants from Norway (2.4%, a difference of 1.5%).
| Demographics | Rating | Rank | Doctorate Degree |
| Estonians | 100.0 /100 | #40 | Exceptional 2.5% |
| Immigrants | Russia | 100.0 /100 | #41 | Exceptional 2.5% |
| New Zealanders | 100.0 /100 | #42 | Exceptional 2.5% |
| Soviet Union | 100.0 /100 | #43 | Exceptional 2.5% |
| Immigrants | Netherlands | 100.0 /100 | #44 | Exceptional 2.5% |
| Immigrants | South Africa | 100.0 /100 | #45 | Exceptional 2.4% |
| Immigrants | Austria | 100.0 /100 | #46 | Exceptional 2.4% |
| Immigrants | Western Europe | 100.0 /100 | #47 | Exceptional 2.4% |
| Asians | 100.0 /100 | #48 | Exceptional 2.4% |
| Immigrants | Asia | 100.0 /100 | #49 | Exceptional 2.4% |
| Immigrants | Norway | 100.0 /100 | #50 | Exceptional 2.4% |
| Australians | 100.0 /100 | #51 | Exceptional 2.4% |
| Bulgarians | 100.0 /100 | #52 | Exceptional 2.4% |
| Immigrants | Latvia | 100.0 /100 | #53 | Exceptional 2.4% |
| Immigrants | Indonesia | 100.0 /100 | #54 | Exceptional 2.4% |
Demographics Similar to Yakama by Doctorate Degree
In terms of doctorate degree, the demographic groups most similar to Yakama are Immigrants from Caribbean (1.3%, a difference of 0.16%), Immigrants from Dominican Republic (1.3%, a difference of 0.35%), Immigrants from Latin America (1.3%, a difference of 1.6%), Yup'ik (1.3%, a difference of 1.6%), and Haitian (1.3%, a difference of 1.8%).
| Demographics | Rating | Rank | Doctorate Degree |
| Pima | 0.0 /100 | #325 | Tragic 1.3% |
| Immigrants | Cabo Verde | 0.0 /100 | #326 | Tragic 1.3% |
| Hispanics or Latinos | 0.0 /100 | #327 | Tragic 1.3% |
| Inupiat | 0.0 /100 | #328 | Tragic 1.3% |
| Haitians | 0.0 /100 | #329 | Tragic 1.3% |
| Yup'ik | 0.0 /100 | #330 | Tragic 1.3% |
| Immigrants | Latin America | 0.0 /100 | #331 | Tragic 1.3% |
| Yakama | 0.0 /100 | #332 | Tragic 1.3% |
| Immigrants | Caribbean | 0.0 /100 | #333 | Tragic 1.3% |
| Immigrants | Dominican Republic | 0.0 /100 | #334 | Tragic 1.3% |
| Immigrants | Haiti | 0.0 /100 | #335 | Tragic 1.3% |
| Nepalese | 0.0 /100 | #336 | Tragic 1.3% |
| Bangladeshis | 0.0 /100 | #337 | Tragic 1.2% |
| Puget Sound Salish | 0.0 /100 | #338 | Tragic 1.2% |
| Immigrants | Central America | 0.0 /100 | #339 | Tragic 1.2% |