Immigrants from West Indies vs Iraqi Master's Degree

COMPARE

Immigrants from West Indies
Race
Ancestry
AfghanAfricanAlaska NativeAlaskan AthabascanAlbanianAleutAlsatianAmericanApacheArabArapahoArgentineanArmenianAssyrian/Chaldean/SyriacAustralianAustrianBahamianBangladeshiBarbadianBasqueBelgianBelizeanBermudanBhutaneseBlackfeetBolivianBrazilianBritishBritish West IndianBulgarianBurmeseCajunCambodianCanadianCape VerdeanCarpatho RusynCelticCentral AmericanCentral American IndianCherokeeCheyenneChickasawChileanChineseChippewaChoctawColombianColvilleComancheCosta RicanCreeCreekCroatianCrowCubanCypriotCzechCzechoslovakianDanishDelawareDominicanDutchDutch West IndianEastern EuropeanEcuadorianEgyptianEnglishEstonianEthiopianEuropeanFijianFilipinoFinnishFrenchFrench American IndianFrench CanadianGermanGerman RussianGhanaianGreekGuamanian/ChamorroGuatemalanGuyaneseHaitianHmongHonduranHopiHoumaHungarianIcelanderIndian (Asian)IndonesianInupiatIranianIrishIroquoisIsraeliItalianJamaicanJapaneseJordanianKenyanKiowaKoreanLaotianLatvianLebaneseLiberianLithuanianLumbeeLuxembourgerMacedonianMalaysianMalteseMarshalleseMenomineeMexicanMexican American IndianMongolianMoroccanNative HawaiianNavajoNepaleseNew ZealanderNicaraguanNigerianNorthern EuropeanNorwegianOkinawanOsageOttawaPaiutePakistaniPalestinianPanamanianParaguayanPennsylvania GermanPeruvianPimaPolishPortuguesePotawatomiPuebloPuerto RicanPuget Sound SalishRomanianRussianSalvadoranSamoanScandinavianScotch-IrishScottishSeminoleSenegaleseSerbianShoshoneSierra LeoneanSiouxSlavicSlovakSloveneSomaliSouth AfricanSouth AmericanSouth American IndianSoviet UnionSpaniardSpanishSpanish AmericanSpanish American IndianSri LankanSubsaharan AfricanSudaneseSwedishSwissSyrianTaiwaneseThaiTlingit-HaidaTohono O'OdhamTonganTrinidadian and TobagonianTsimshianTurkishU.S. Virgin IslanderUgandanUkrainianUruguayanUteVenezuelanVietnameseWelshWest IndianYakamaYaquiYugoslavianYumanYup'ikZimbabwean
Immigration
NonimmigrantsImmigrantsAfghanistanAfricaAlbaniaArgentinaArmeniaAsiaAustraliaAustriaBahamasBangladeshBarbadosBelarusBelgiumBelizeBoliviaBosnia and HerzegovinaBrazilBulgariaBurma/MyanmarCabo VerdeCambodiaCameroonCanadaCaribbeanCentral AmericaChileChinaColombiaCongoCosta RicaCroatiaCubaCzechoslovakiaDenmarkDominicaDominican RepublicEastern AfricaEastern AsiaEastern EuropeEcuadorEgyptEl SalvadorEnglandEritreaEthiopiaEuropeFijiFranceGermanyGhanaGreeceGrenadaGuatemalaGuyanaHaitiHondurasHong KongHungaryIndiaIndonesiaIranIraqIrelandIsraelItalyJamaicaJapanJordanKazakhstanKenyaKoreaKuwaitLaosLatin AmericaLatviaLebanonLiberiaLithuaniaMalaysiaMexicoMicronesiaMiddle AfricaMoldovaMoroccoNepalNetherlandsNicaraguaNigeriaNorth AmericaNorth MacedoniaNorthern AfricaNorthern EuropeNorwayOceaniaPakistanPanamaPeruPhilippinesPolandPortugalRomaniaRussiaSaudi ArabiaScotlandSenegalSerbiaSierra LeoneSingaporeSomaliaSouth AfricaSouth AmericaSouth Central AsiaSouth Eastern AsiaSouthern EuropeSpainSri LankaSt. Vincent and the GrenadinesSudanSwedenSwitzerlandSyriaTaiwanThailandTrinidad and TobagoTurkeyUgandaUkraineUruguayUzbekistanVenezuelaVietnamWest IndiesWestern AfricaWestern AsiaWestern EuropeYemenZaireZimbabweAzores
Iraqi
Race
Ancestry
AfghanAfricanAlaska NativeAlaskan AthabascanAlbanianAleutAlsatianAmericanApacheArabArapahoArgentineanArmenianAssyrian/Chaldean/SyriacAustralianAustrianBahamianBangladeshiBarbadianBasqueBelgianBelizeanBermudanBhutaneseBlackfeetBolivianBrazilianBritishBritish West IndianBulgarianBurmeseCajunCambodianCanadianCape VerdeanCarpatho RusynCelticCentral AmericanCentral American IndianCherokeeCheyenneChickasawChileanChineseChippewaChoctawColombianColvilleComancheCosta RicanCreeCreekCroatianCrowCubanCypriotCzechCzechoslovakianDanishDelawareDominicanDutchDutch West IndianEastern EuropeanEcuadorianEgyptianEnglishEstonianEthiopianEuropeanFijianFilipinoFinnishFrenchFrench American IndianFrench CanadianGermanGerman RussianGhanaianGreekGuamanian/ChamorroGuatemalanGuyaneseHaitianHmongHonduranHopiHoumaHungarianIcelanderIndian (Asian)IndonesianInupiatIranianIraqiIrishIroquoisIsraeliItalianJamaicanJapaneseJordanianKenyanKiowaKoreanLaotianLatvianLebaneseLiberianLithuanianLumbeeLuxembourgerMacedonianMalaysianMalteseMarshalleseMenomineeMexicanMexican American IndianMongolianMoroccanNative HawaiianNavajoNepaleseNew ZealanderNicaraguanNigerianNorthern EuropeanNorwegianOkinawanOsageOttawaPaiutePakistaniPalestinianPanamanianParaguayanPennsylvania GermanPeruvianPimaPolishPortuguesePotawatomiPuebloPuerto RicanPuget Sound SalishRomanianRussianSalvadoranSamoanScandinavianScotch-IrishScottishSeminoleSenegaleseSerbianShoshoneSierra LeoneanSiouxSlavicSlovakSloveneSomaliSouth AfricanSouth AmericanSouth American IndianSoviet UnionSpaniardSpanishSpanish AmericanSpanish American IndianSri LankanSubsaharan AfricanSudaneseSwedishSwissSyrianTaiwaneseThaiTlingit-HaidaTohono O'OdhamTonganTrinidadian and TobagonianTsimshianTurkishU.S. Virgin IslanderUgandanUkrainianUruguayanUteVenezuelanVietnameseWelshWest IndianYakamaYaquiYugoslavianYumanYup'ikZimbabwean
Immigration
NonimmigrantsImmigrantsAfghanistanAfricaAlbaniaArgentinaArmeniaAsiaAustraliaAustriaBahamasBangladeshBarbadosBelarusBelgiumBelizeBoliviaBosnia and HerzegovinaBrazilBulgariaBurma/MyanmarCabo VerdeCambodiaCameroonCanadaCaribbeanCentral AmericaChileChinaColombiaCongoCosta RicaCroatiaCubaCzechoslovakiaDenmarkDominicaDominican RepublicEastern AfricaEastern AsiaEastern EuropeEcuadorEgyptEl SalvadorEnglandEritreaEthiopiaEuropeFijiFranceGermanyGhanaGreeceGrenadaGuatemalaGuyanaHaitiHondurasHong KongHungaryIndiaIndonesiaIranIraqIrelandIsraelItalyJamaicaJapanJordanKazakhstanKenyaKoreaKuwaitLaosLatin AmericaLatviaLebanonLiberiaLithuaniaMalaysiaMexicoMicronesiaMiddle AfricaMoldovaMoroccoNepalNetherlandsNicaraguaNigeriaNorth AmericaNorth MacedoniaNorthern AfricaNorthern EuropeNorwayOceaniaPakistanPanamaPeruPhilippinesPolandPortugalRomaniaRussiaSaudi ArabiaScotlandSenegalSerbiaSierra LeoneSingaporeSomaliaSouth AfricaSouth AmericaSouth Central AsiaSouth Eastern AsiaSouthern EuropeSpainSri LankaSt. Vincent and the GrenadinesSudanSwedenSwitzerlandSyriaTaiwanThailandTrinidad and TobagoTurkeyUgandaUkraineUruguayUzbekistanVenezuelaVietnamWestern AfricaWestern AsiaWestern EuropeYemenZaireZimbabweAzores
Master's Degree
Income
Poverty
Unemployment
Labor Participation
Family Structure
Vehicle Availability
Education Level
Disability

Master's Degree Comparison

Immigrants from West Indies

Iraqis

Tragic
Good
13.9%
MASTER'S DEGREE
9.8/ 100
METRIC RATING
227th/ 347
METRIC RANK
15.5%
MASTER'S DEGREE
77.3/ 100
METRIC RATING
151st/ 347
METRIC RANK

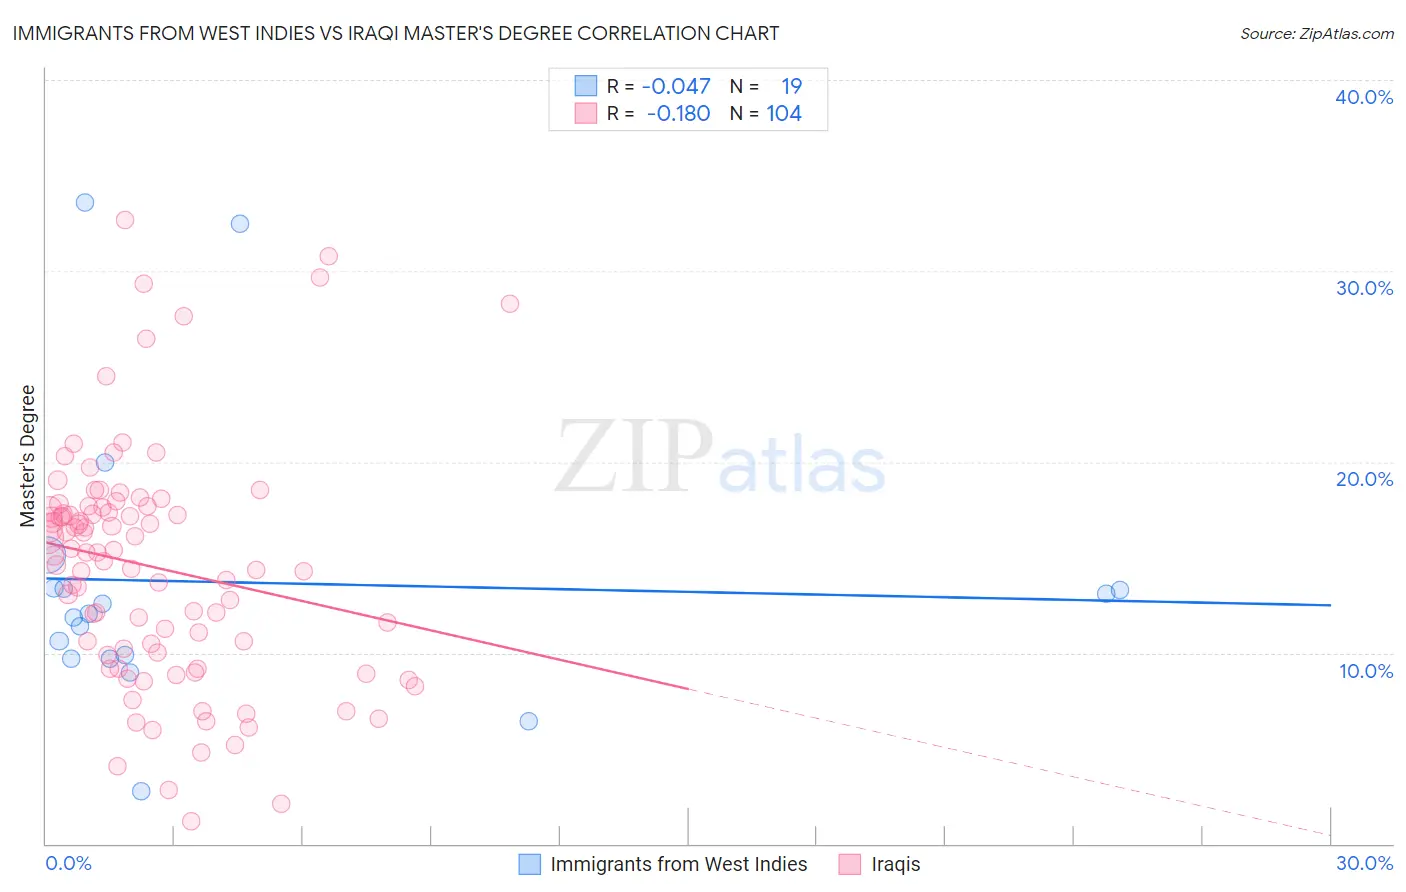
Immigrants from West Indies vs Iraqi Master's Degree Correlation Chart

The statistical analysis conducted on geographies consisting of 72,456,461 people shows no correlation between the proportion of Immigrants from West Indies and percentage of population with at least master's degree education in the United States with a correlation coefficient (R) of -0.047 and weighted average of 13.9%. Similarly, the statistical analysis conducted on geographies consisting of 170,638,714 people shows a poor negative correlation between the proportion of Iraqis and percentage of population with at least master's degree education in the United States with a correlation coefficient (R) of -0.180 and weighted average of 15.5%, a difference of 11.8%.
Immigrants from West Indies vs Iraqi Master's Degree

Master's Degree Correlation Summary

MeasurementImmigrants from West IndiesIraqi
Minimum2.7%1.1%
Maximum33.6%32.7%
Range30.8%31.5%
Mean13.7%14.5%
Median12.1%15.2%
Interquartile 25% (IQ1)9.7%9.9%
Interquartile 75% (IQ3)13.4%17.6%
Interquartile Range (IQR)3.7%7.7%
Standard Deviation (Sample)7.6%6.2%
Standard Deviation (Population)7.4%6.2%

Similar Demographics by Master's Degree

Demographics Similar to Immigrants from West Indies by Master's Degree

In terms of master's degree, the demographic groups most similar to Immigrants from West Indies are White/Caucasian (13.8%, a difference of 0.31%), British West Indian (13.8%, a difference of 0.42%), Immigrants from St. Vincent and the Grenadines (13.9%, a difference of 0.44%), Dutch (13.8%, a difference of 0.45%), and Portuguese (13.9%, a difference of 0.50%).
DemographicsRating | RankMaster's Degree
Germans
13.1
/100
|
#220
Poor
14.0%
Koreans
12.7
/100
|
#221
Poor
14.0%
Ecuadorians
12.6
/100
|
#222
Poor
14.0%
Immigrants | South Eastern Asia
11.9
/100
|
#223
Poor
14.0%
Immigrants | Grenada
11.8
/100
|
#224
Poor
14.0%
Portuguese
11.2
/100
|
#225
Poor
13.9%
Immigrants | St. Vincent and the Grenadines
11.0
/100
|
#226
Poor
13.9%
Immigrants | West Indies
9.8
/100
|
#227
Tragic
13.9%
Whites/Caucasians
9.1
/100
|
#228
Tragic
13.8%
British West Indians
8.8
/100
|
#229
Tragic
13.8%
Dutch
8.7
/100
|
#230
Tragic
13.8%
Guyanese
7.6
/100
|
#231
Tragic
13.7%
Immigrants | Philippines
6.0
/100
|
#232
Tragic
13.6%
Immigrants | Ecuador
5.7
/100
|
#233
Tragic
13.6%
Immigrants | Burma/Myanmar
5.0
/100
|
#234
Tragic
13.5%

Demographics Similar to Iraqis by Master's Degree

In terms of master's degree, the demographic groups most similar to Iraqis are Slavic (15.5%, a difference of 0.050%), Icelander (15.5%, a difference of 0.080%), Slovene (15.5%, a difference of 0.12%), Immigrants from Senegal (15.5%, a difference of 0.16%), and Ghanaian (15.5%, a difference of 0.16%).
DemographicsRating | RankMaster's Degree
Canadians
83.3
/100
|
#144
Excellent
15.7%
South Americans
81.3
/100
|
#145
Excellent
15.6%
Immigrants | Afghanistan
79.4
/100
|
#146
Good
15.6%
Hungarians
79.1
/100
|
#147
Good
15.6%
Immigrants | Senegal
78.2
/100
|
#148
Good
15.5%
Ghanaians
78.2
/100
|
#149
Good
15.5%
Slovenes
78.0
/100
|
#150
Good
15.5%
Iraqis
77.3
/100
|
#151
Good
15.5%
Slavs
77.0
/100
|
#152
Good
15.5%
Icelanders
76.8
/100
|
#153
Good
15.5%
Immigrants | South America
76.3
/100
|
#154
Good
15.5%
Immigrants | Bangladesh
76.1
/100
|
#155
Good
15.5%
Bermudans
73.9
/100
|
#156
Good
15.4%
Immigrants | Cameroon
71.7
/100
|
#157
Good
15.4%
Immigrants | Poland
71.5
/100
|
#158
Good
15.4%