Immigrants from West Indies vs Immigrants from Caribbean Nursery School
COMPARE
Immigrants from West Indies
Immigrants from Caribbean
Nursery School
Nursery School Comparison
Immigrants from West Indies
Immigrants from Caribbean
97.4%
NURSERY SCHOOL
0.0/ 100
METRIC RATING
283rd/ 347
METRIC RANK
97.1%
NURSERY SCHOOL
0.0/ 100
METRIC RATING
302nd/ 347
METRIC RANK
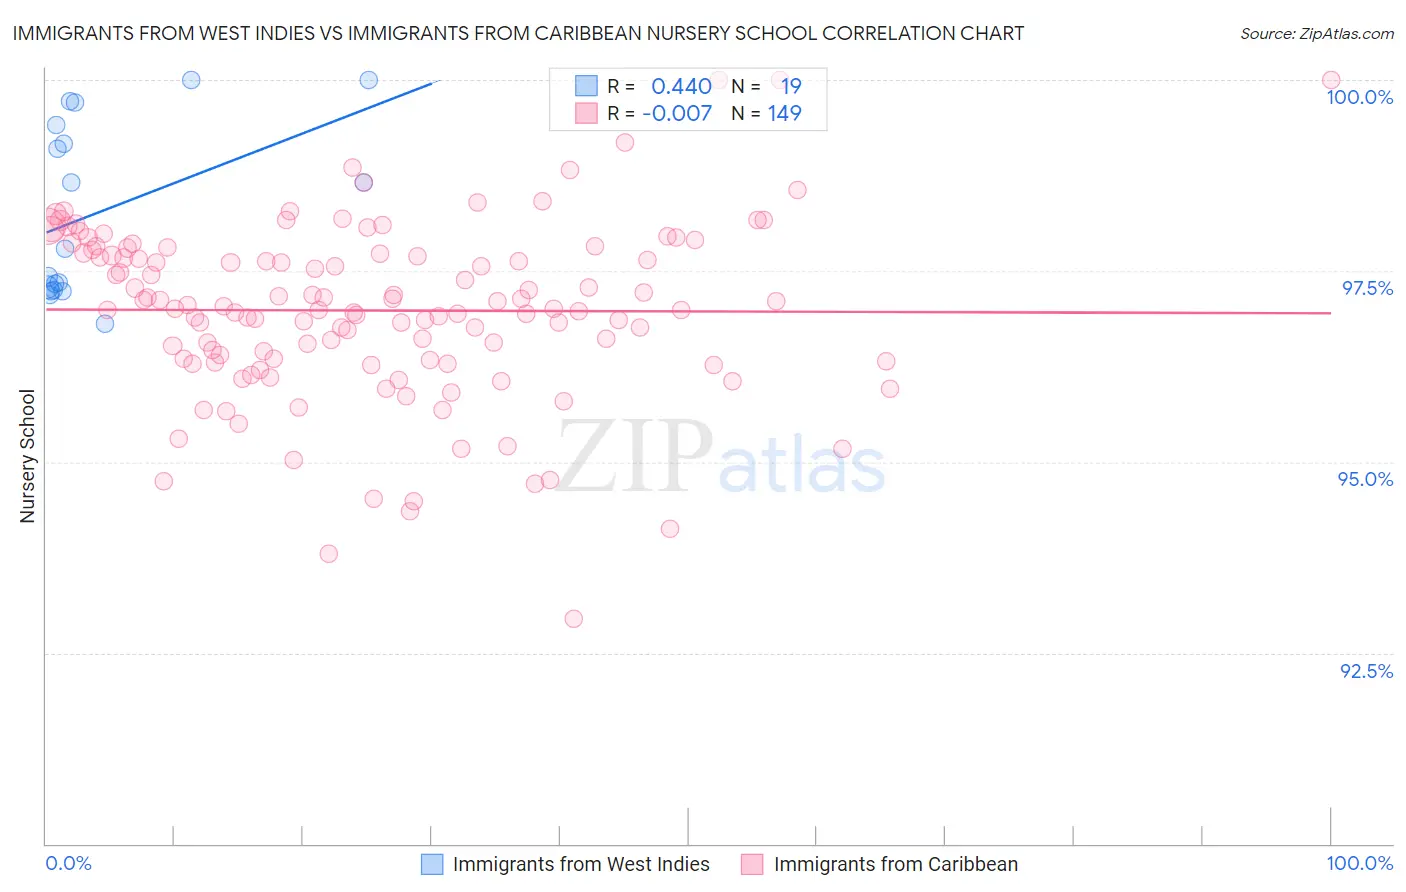
Immigrants from West Indies vs Immigrants from Caribbean Nursery School Correlation Chart
The statistical analysis conducted on geographies consisting of 72,457,514 people shows a moderate positive correlation between the proportion of Immigrants from West Indies and percentage of population with at least nursery school education in the United States with a correlation coefficient (R) of 0.440 and weighted average of 97.4%. Similarly, the statistical analysis conducted on geographies consisting of 450,023,263 people shows no correlation between the proportion of Immigrants from Caribbean and percentage of population with at least nursery school education in the United States with a correlation coefficient (R) of -0.007 and weighted average of 97.1%, a difference of 0.28%.
Nursery School Correlation Summary
| Measurement | Immigrants from West Indies | Immigrants from Caribbean |
| Minimum | 96.8% | 93.0% |
| Maximum | 100.0% | 100.0% |
| Range | 3.2% | 7.0% |
| Mean | 98.3% | 97.0% |
| Median | 97.8% | 97.0% |
| Interquartile 25% (IQ1) | 97.2% | 96.3% |
| Interquartile 75% (IQ3) | 99.4% | 97.8% |
| Interquartile Range (IQR) | 2.2% | 1.4% |
| Standard Deviation (Sample) | 1.1% | 1.2% |
| Standard Deviation (Population) | 1.1% | 1.2% |
Demographics Similar to Immigrants from West Indies and Immigrants from Caribbean by Nursery School
In terms of nursery school, the demographic groups most similar to Immigrants from West Indies are Immigrants from Trinidad and Tobago (97.4%, a difference of 0.0%), Immigrants from Barbados (97.4%, a difference of 0.020%), Immigrants from Portugal (97.4%, a difference of 0.020%), Immigrants from Hong Kong (97.4%, a difference of 0.030%), and Afghan (97.4%, a difference of 0.040%). Similarly, the demographic groups most similar to Immigrants from Caribbean are Immigrants from South Eastern Asia (97.1%, a difference of 0.030%), Haitian (97.2%, a difference of 0.060%), Immigrants from Dominica (97.2%, a difference of 0.070%), Central American Indian (97.2%, a difference of 0.080%), and Immigrants from Cuba (97.2%, a difference of 0.090%).
| Demographics | Rating | Rank | Nursery School |
| Afghans | 0.0 /100 | #282 | Tragic 97.4% |
| Immigrants | West Indies | 0.0 /100 | #283 | Tragic 97.4% |
| Immigrants | Trinidad and Tobago | 0.0 /100 | #284 | Tragic 97.4% |
| Immigrants | Barbados | 0.0 /100 | #285 | Tragic 97.4% |
| Immigrants | Portugal | 0.0 /100 | #286 | Tragic 97.4% |
| Immigrants | Hong Kong | 0.0 /100 | #287 | Tragic 97.4% |
| Immigrants | Thailand | 0.0 /100 | #288 | Tragic 97.3% |
| Immigrants | St. Vincent and the Grenadines | 0.0 /100 | #289 | Tragic 97.3% |
| Immigrants | Afghanistan | 0.0 /100 | #290 | Tragic 97.3% |
| British West Indians | 0.0 /100 | #291 | Tragic 97.3% |
| Houma | 0.0 /100 | #292 | Tragic 97.3% |
| Malaysians | 0.0 /100 | #293 | Tragic 97.3% |
| Immigrants | Grenada | 0.0 /100 | #294 | Tragic 97.3% |
| Immigrants | Immigrants | 0.0 /100 | #295 | Tragic 97.2% |
| Immigrants | Eritrea | 0.0 /100 | #296 | Tragic 97.2% |
| Immigrants | Cuba | 0.0 /100 | #297 | Tragic 97.2% |
| Central American Indians | 0.0 /100 | #298 | Tragic 97.2% |
| Immigrants | Dominica | 0.0 /100 | #299 | Tragic 97.2% |
| Haitians | 0.0 /100 | #300 | Tragic 97.2% |
| Immigrants | South Eastern Asia | 0.0 /100 | #301 | Tragic 97.1% |
| Immigrants | Caribbean | 0.0 /100 | #302 | Tragic 97.1% |