Immigrants from Vietnam vs Immigrants from Cabo Verde Nursery School
COMPARE
Immigrants from Vietnam
Immigrants from Cabo Verde
Nursery School
Nursery School Comparison
Immigrants from Vietnam
Immigrants from Cabo Verde
96.7%
NURSERY SCHOOL
0.0/ 100
METRIC RATING
329th/ 347
METRIC RANK
96.4%
NURSERY SCHOOL
0.0/ 100
METRIC RATING
341st/ 347
METRIC RANK
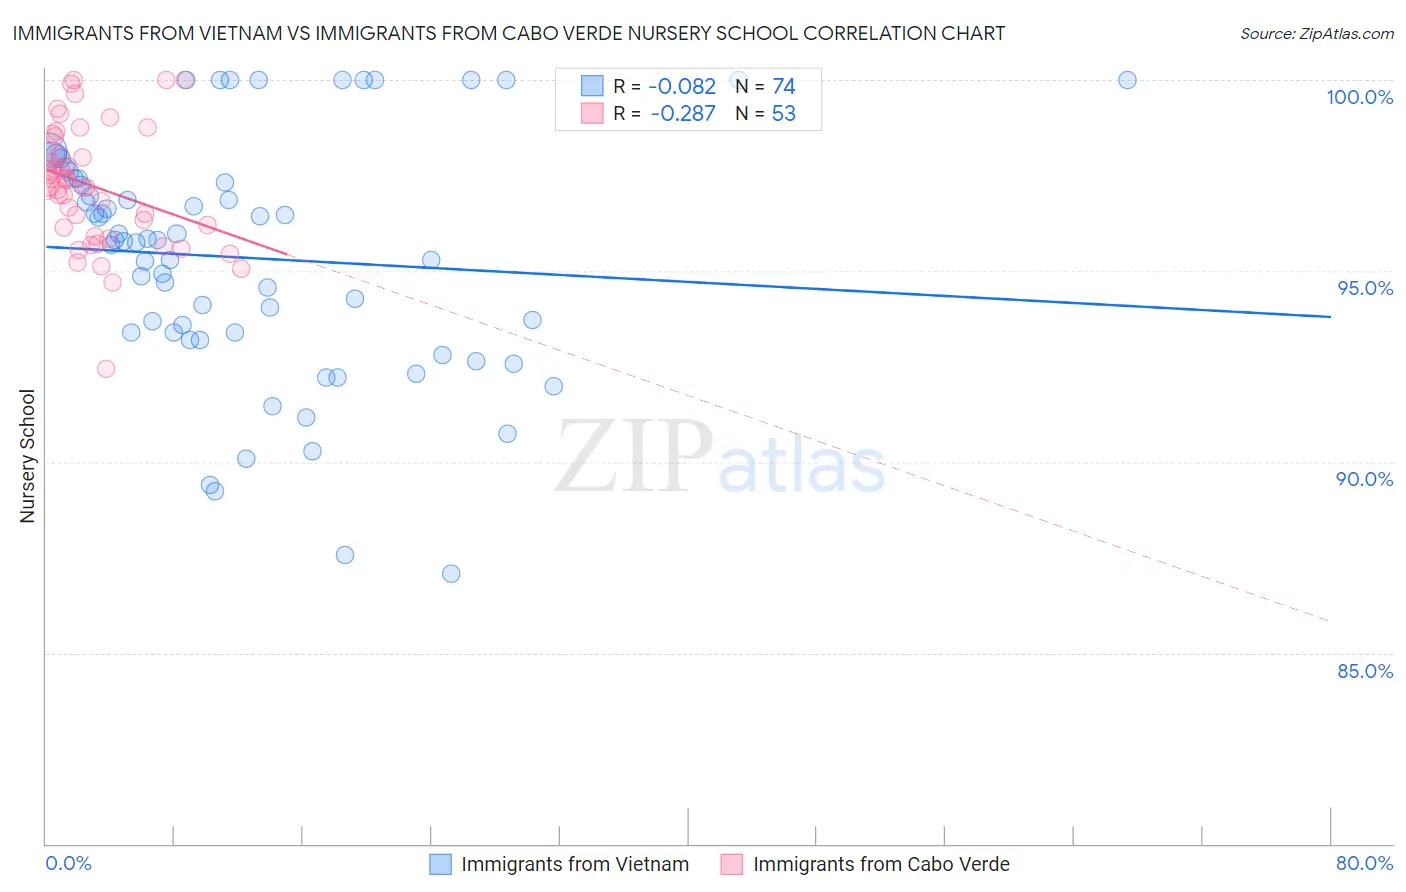
Immigrants from Vietnam vs Immigrants from Cabo Verde Nursery School Correlation Chart
The statistical analysis conducted on geographies consisting of 404,844,130 people shows a slight negative correlation between the proportion of Immigrants from Vietnam and percentage of population with at least nursery school education in the United States with a correlation coefficient (R) of -0.082 and weighted average of 96.7%. Similarly, the statistical analysis conducted on geographies consisting of 38,158,666 people shows a weak negative correlation between the proportion of Immigrants from Cabo Verde and percentage of population with at least nursery school education in the United States with a correlation coefficient (R) of -0.287 and weighted average of 96.4%, a difference of 0.31%.
Nursery School Correlation Summary
| Measurement | Immigrants from Vietnam | Immigrants from Cabo Verde |
| Minimum | 87.1% | 92.5% |
| Maximum | 100.0% | 100.0% |
| Range | 12.9% | 7.5% |
| Mean | 95.3% | 97.2% |
| Median | 95.8% | 97.2% |
| Interquartile 25% (IQ1) | 93.4% | 96.0% |
| Interquartile 75% (IQ3) | 97.4% | 98.3% |
| Interquartile Range (IQR) | 4.0% | 2.3% |
| Standard Deviation (Sample) | 3.1% | 1.6% |
| Standard Deviation (Population) | 3.1% | 1.5% |
Demographics Similar to Immigrants from Vietnam and Immigrants from Cabo Verde by Nursery School
In terms of nursery school, the demographic groups most similar to Immigrants from Vietnam are Japanese (96.7%, a difference of 0.010%), Immigrants from Armenia (96.7%, a difference of 0.030%), Immigrants from Latin America (96.7%, a difference of 0.050%), Yakama (96.6%, a difference of 0.050%), and Mexican (96.8%, a difference of 0.060%). Similarly, the demographic groups most similar to Immigrants from Cabo Verde are Immigrants from Mexico (96.4%, a difference of 0.010%), Immigrants from Central America (96.4%, a difference of 0.020%), Salvadoran (96.4%, a difference of 0.040%), Immigrants from Guatemala (96.4%, a difference of 0.060%), and Immigrants from Cambodia (96.5%, a difference of 0.13%).
| Demographics | Rating | Rank | Nursery School |
| Dominicans | 0.0 /100 | #325 | Tragic 96.8% |
| Indonesians | 0.0 /100 | #326 | Tragic 96.8% |
| Mexicans | 0.0 /100 | #327 | Tragic 96.8% |
| Immigrants | Latin America | 0.0 /100 | #328 | Tragic 96.7% |
| Immigrants | Vietnam | 0.0 /100 | #329 | Tragic 96.7% |
| Japanese | 0.0 /100 | #330 | Tragic 96.7% |
| Immigrants | Armenia | 0.0 /100 | #331 | Tragic 96.7% |
| Yakama | 0.0 /100 | #332 | Tragic 96.6% |
| Central Americans | 0.0 /100 | #333 | Tragic 96.6% |
| Immigrants | Dominican Republic | 0.0 /100 | #334 | Tragic 96.6% |
| Bangladeshis | 0.0 /100 | #335 | Tragic 96.6% |
| Guatemalans | 0.0 /100 | #336 | Tragic 96.6% |
| Immigrants | Cambodia | 0.0 /100 | #337 | Tragic 96.5% |
| Immigrants | Fiji | 0.0 /100 | #338 | Tragic 96.5% |
| Immigrants | Guatemala | 0.0 /100 | #339 | Tragic 96.4% |
| Immigrants | Central America | 0.0 /100 | #340 | Tragic 96.4% |
| Immigrants | Cabo Verde | 0.0 /100 | #341 | Tragic 96.4% |
| Immigrants | Mexico | 0.0 /100 | #342 | Tragic 96.4% |
| Salvadorans | 0.0 /100 | #343 | Tragic 96.4% |
| Immigrants | El Salvador | 0.0 /100 | #344 | Tragic 96.2% |
| Nepalese | 0.0 /100 | #345 | Tragic 96.2% |