Immigrants from Vietnam vs Tsimshian Nursery School
COMPARE
Immigrants from Vietnam
Tsimshian
Nursery School
Nursery School Comparison
Immigrants from Vietnam
Tsimshian
96.7%
NURSERY SCHOOL
0.0/ 100
METRIC RATING
329th/ 347
METRIC RANK
98.9%
NURSERY SCHOOL
100.0/ 100
METRIC RATING
5th/ 347
METRIC RANK
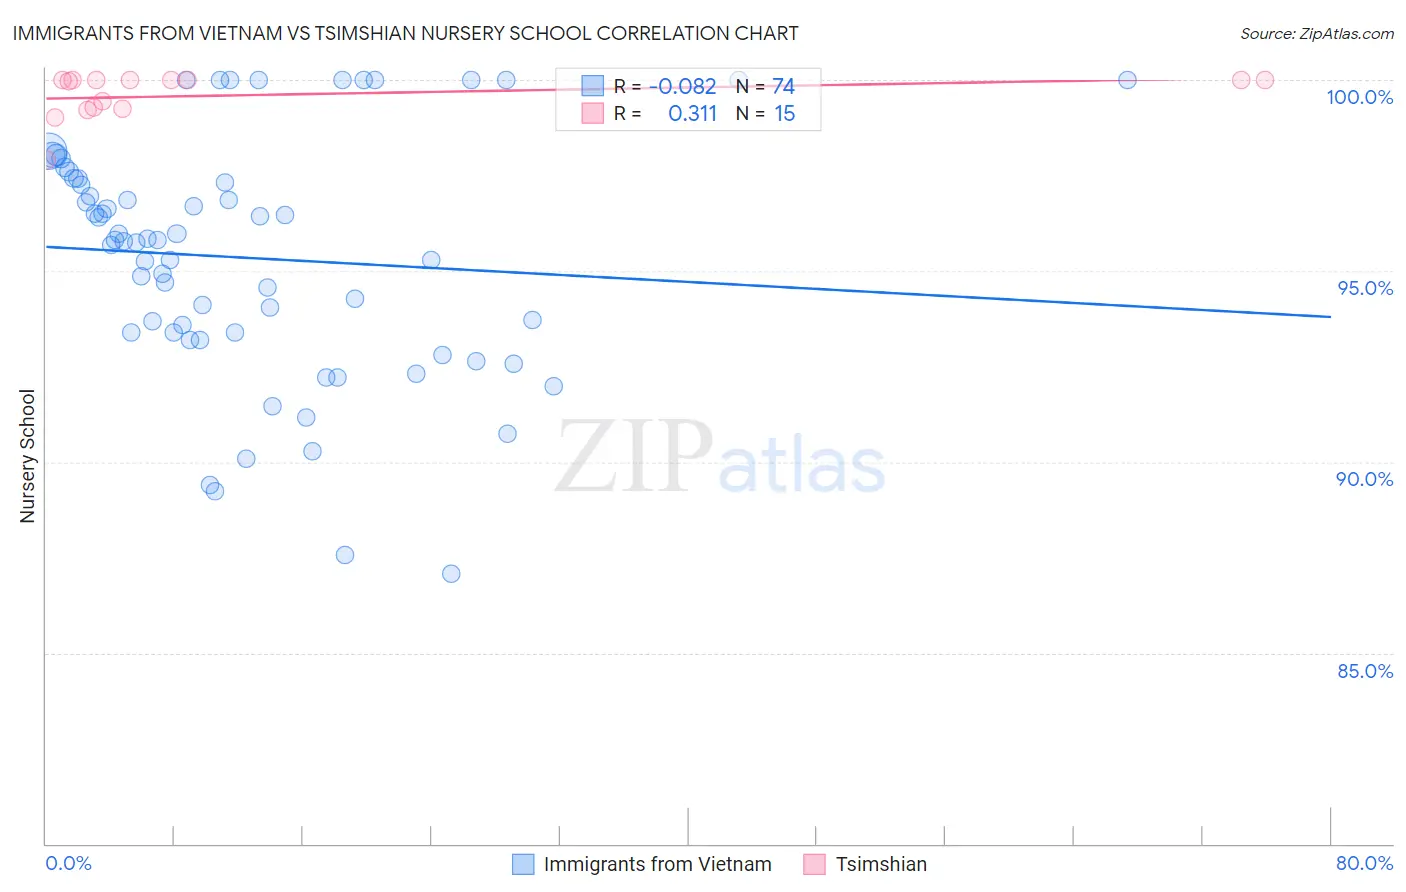
Immigrants from Vietnam vs Tsimshian Nursery School Correlation Chart
The statistical analysis conducted on geographies consisting of 404,844,130 people shows a slight negative correlation between the proportion of Immigrants from Vietnam and percentage of population with at least nursery school education in the United States with a correlation coefficient (R) of -0.082 and weighted average of 96.7%. Similarly, the statistical analysis conducted on geographies consisting of 15,626,544 people shows a mild positive correlation between the proportion of Tsimshian and percentage of population with at least nursery school education in the United States with a correlation coefficient (R) of 0.311 and weighted average of 98.9%, a difference of 2.2%.
Nursery School Correlation Summary
| Measurement | Immigrants from Vietnam | Tsimshian |
| Minimum | 87.1% | 97.9% |
| Maximum | 100.0% | 100.0% |
| Range | 12.9% | 2.1% |
| Mean | 95.3% | 99.6% |
| Median | 95.8% | 100.0% |
| Interquartile 25% (IQ1) | 93.4% | 99.2% |
| Interquartile 75% (IQ3) | 97.4% | 100.0% |
| Interquartile Range (IQR) | 4.0% | 0.76% |
| Standard Deviation (Sample) | 3.1% | 0.60% |
| Standard Deviation (Population) | 3.1% | 0.58% |
Similar Demographics by Nursery School
Demographics Similar to Immigrants from Vietnam by Nursery School
In terms of nursery school, the demographic groups most similar to Immigrants from Vietnam are Japanese (96.7%, a difference of 0.010%), Immigrants from Armenia (96.7%, a difference of 0.030%), Immigrants from Latin America (96.7%, a difference of 0.050%), Yakama (96.6%, a difference of 0.050%), and Mexican (96.8%, a difference of 0.060%).
| Demographics | Rating | Rank | Nursery School |
| Mexican American Indians | 0.0 /100 | #322 | Tragic 96.9% |
| Immigrants | Honduras | 0.0 /100 | #323 | Tragic 96.9% |
| Vietnamese | 0.0 /100 | #324 | Tragic 96.8% |
| Dominicans | 0.0 /100 | #325 | Tragic 96.8% |
| Indonesians | 0.0 /100 | #326 | Tragic 96.8% |
| Mexicans | 0.0 /100 | #327 | Tragic 96.8% |
| Immigrants | Latin America | 0.0 /100 | #328 | Tragic 96.7% |
| Immigrants | Vietnam | 0.0 /100 | #329 | Tragic 96.7% |
| Japanese | 0.0 /100 | #330 | Tragic 96.7% |
| Immigrants | Armenia | 0.0 /100 | #331 | Tragic 96.7% |
| Yakama | 0.0 /100 | #332 | Tragic 96.6% |
| Central Americans | 0.0 /100 | #333 | Tragic 96.6% |
| Immigrants | Dominican Republic | 0.0 /100 | #334 | Tragic 96.6% |
| Bangladeshis | 0.0 /100 | #335 | Tragic 96.6% |
| Guatemalans | 0.0 /100 | #336 | Tragic 96.6% |
Demographics Similar to Tsimshian by Nursery School
In terms of nursery school, the demographic groups most similar to Tsimshian are Welsh (98.9%, a difference of 0.030%), Inupiat (98.9%, a difference of 0.030%), Alaskan Athabascan (98.8%, a difference of 0.070%), Alaska Native (98.8%, a difference of 0.10%), and Norwegian (98.7%, a difference of 0.12%).
| Demographics | Rating | Rank | Nursery School |
| Crow | 100.0 /100 | #1 | Exceptional 99.7% |
| Yup'ik | 100.0 /100 | #2 | Exceptional 99.2% |
| Welsh | 100.0 /100 | #3 | Exceptional 98.9% |
| Inupiat | 100.0 /100 | #4 | Exceptional 98.9% |
| Tsimshian | 100.0 /100 | #5 | Exceptional 98.9% |
| Alaskan Athabascans | 100.0 /100 | #6 | Exceptional 98.8% |
| Alaska Natives | 100.0 /100 | #7 | Exceptional 98.8% |
| Norwegians | 100.0 /100 | #8 | Exceptional 98.7% |
| Slovaks | 100.0 /100 | #9 | Exceptional 98.7% |
| Germans | 100.0 /100 | #10 | Exceptional 98.7% |
| Tlingit-Haida | 100.0 /100 | #11 | Exceptional 98.7% |
| Slovenes | 100.0 /100 | #12 | Exceptional 98.7% |
| English | 100.0 /100 | #13 | Exceptional 98.7% |
| Carpatho Rusyns | 100.0 /100 | #14 | Exceptional 98.7% |
| Swedes | 100.0 /100 | #15 | Exceptional 98.7% |