Immigrants from Southern Europe vs Immigrants from Cabo Verde Nursery School
COMPARE
Immigrants from Southern Europe
Immigrants from Cabo Verde
Nursery School
Nursery School Comparison
Immigrants from Southern Europe
Immigrants from Cabo Verde
97.9%
NURSERY SCHOOL
17.4/ 100
METRIC RATING
204th/ 347
METRIC RANK
96.4%
NURSERY SCHOOL
0.0/ 100
METRIC RATING
341st/ 347
METRIC RANK
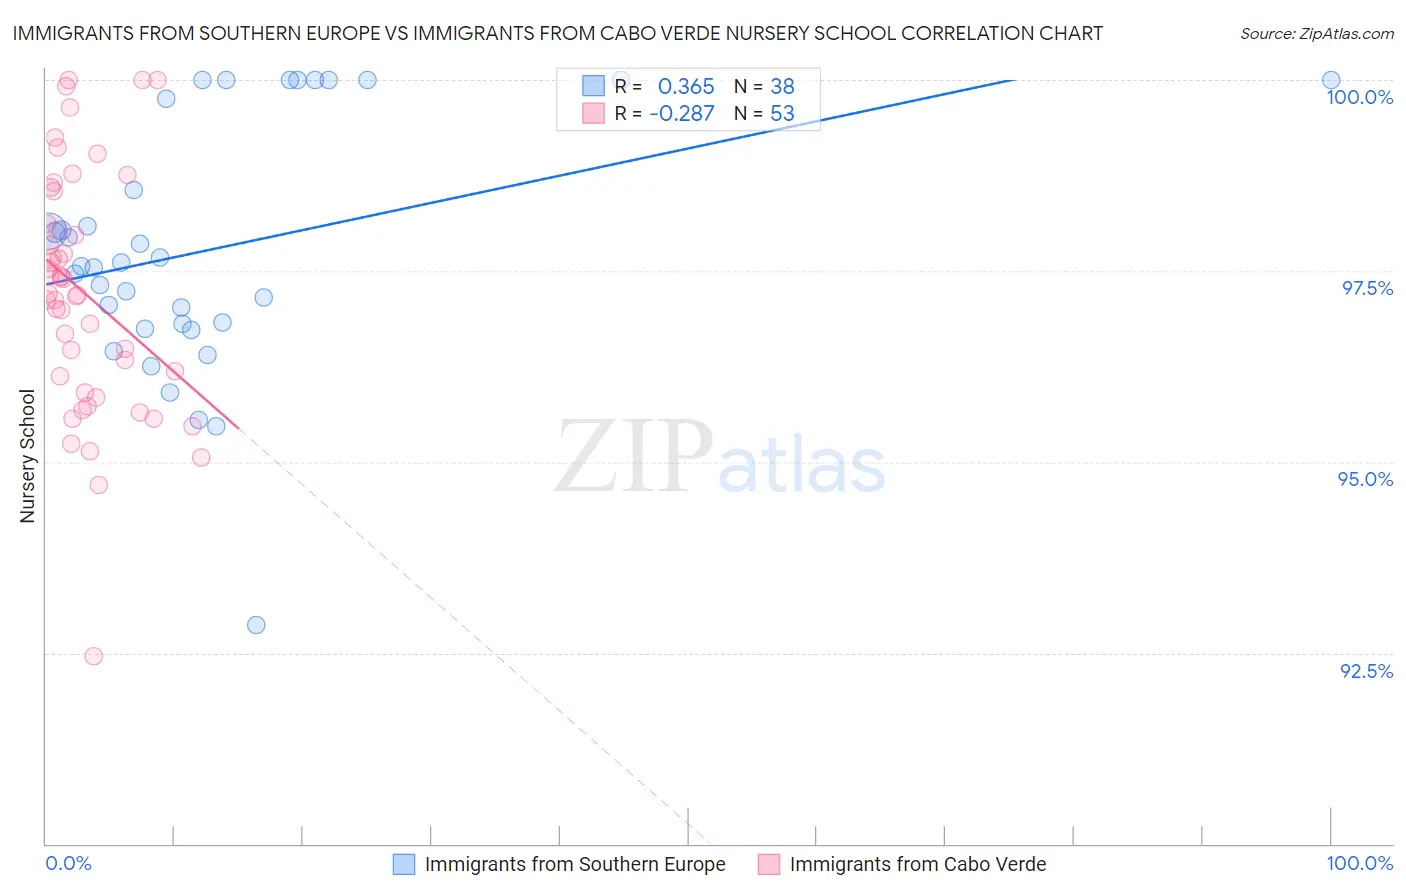
Immigrants from Southern Europe vs Immigrants from Cabo Verde Nursery School Correlation Chart
The statistical analysis conducted on geographies consisting of 402,804,595 people shows a mild positive correlation between the proportion of Immigrants from Southern Europe and percentage of population with at least nursery school education in the United States with a correlation coefficient (R) of 0.365 and weighted average of 97.9%. Similarly, the statistical analysis conducted on geographies consisting of 38,158,666 people shows a weak negative correlation between the proportion of Immigrants from Cabo Verde and percentage of population with at least nursery school education in the United States with a correlation coefficient (R) of -0.287 and weighted average of 96.4%, a difference of 1.5%.
Nursery School Correlation Summary
| Measurement | Immigrants from Southern Europe | Immigrants from Cabo Verde |
| Minimum | 92.9% | 92.5% |
| Maximum | 100.0% | 100.0% |
| Range | 7.1% | 7.5% |
| Mean | 97.8% | 97.2% |
| Median | 97.6% | 97.2% |
| Interquartile 25% (IQ1) | 96.8% | 96.0% |
| Interquartile 75% (IQ3) | 99.8% | 98.3% |
| Interquartile Range (IQR) | 2.9% | 2.3% |
| Standard Deviation (Sample) | 1.6% | 1.6% |
| Standard Deviation (Population) | 1.6% | 1.5% |
Similar Demographics by Nursery School
Demographics Similar to Immigrants from Southern Europe by Nursery School
In terms of nursery school, the demographic groups most similar to Immigrants from Southern Europe are Immigrants from Uganda (97.9%, a difference of 0.0%), Immigrants from Chile (97.9%, a difference of 0.0%), Immigrants from Ukraine (97.9%, a difference of 0.010%), Immigrants from Albania (97.9%, a difference of 0.010%), and African (97.9%, a difference of 0.010%).
| Demographics | Rating | Rank | Nursery School |
| Yuman | 25.7 /100 | #197 | Fair 97.9% |
| Immigrants | Kenya | 24.1 /100 | #198 | Fair 97.9% |
| Immigrants | Egypt | 22.5 /100 | #199 | Fair 97.9% |
| Tohono O'odham | 22.2 /100 | #200 | Fair 97.9% |
| Immigrants | Lebanon | 21.2 /100 | #201 | Fair 97.9% |
| Immigrants | Ukraine | 19.9 /100 | #202 | Poor 97.9% |
| Immigrants | Uganda | 18.0 /100 | #203 | Poor 97.9% |
| Immigrants | Southern Europe | 17.4 /100 | #204 | Poor 97.9% |
| Immigrants | Chile | 17.3 /100 | #205 | Poor 97.9% |
| Immigrants | Albania | 16.4 /100 | #206 | Poor 97.9% |
| Africans | 15.4 /100 | #207 | Poor 97.9% |
| Immigrants | Northern Africa | 11.7 /100 | #208 | Poor 97.8% |
| Costa Ricans | 11.3 /100 | #209 | Poor 97.8% |
| Immigrants | Oceania | 10.2 /100 | #210 | Poor 97.8% |
| Laotians | 9.8 /100 | #211 | Tragic 97.8% |
Demographics Similar to Immigrants from Cabo Verde by Nursery School
In terms of nursery school, the demographic groups most similar to Immigrants from Cabo Verde are Immigrants from Mexico (96.4%, a difference of 0.010%), Immigrants from Central America (96.4%, a difference of 0.020%), Salvadoran (96.4%, a difference of 0.040%), Immigrants from Guatemala (96.4%, a difference of 0.060%), and Immigrants from Cambodia (96.5%, a difference of 0.13%).
| Demographics | Rating | Rank | Nursery School |
| Central Americans | 0.0 /100 | #333 | Tragic 96.6% |
| Immigrants | Dominican Republic | 0.0 /100 | #334 | Tragic 96.6% |
| Bangladeshis | 0.0 /100 | #335 | Tragic 96.6% |
| Guatemalans | 0.0 /100 | #336 | Tragic 96.6% |
| Immigrants | Cambodia | 0.0 /100 | #337 | Tragic 96.5% |
| Immigrants | Fiji | 0.0 /100 | #338 | Tragic 96.5% |
| Immigrants | Guatemala | 0.0 /100 | #339 | Tragic 96.4% |
| Immigrants | Central America | 0.0 /100 | #340 | Tragic 96.4% |
| Immigrants | Cabo Verde | 0.0 /100 | #341 | Tragic 96.4% |
| Immigrants | Mexico | 0.0 /100 | #342 | Tragic 96.4% |
| Salvadorans | 0.0 /100 | #343 | Tragic 96.4% |
| Immigrants | El Salvador | 0.0 /100 | #344 | Tragic 96.2% |
| Nepalese | 0.0 /100 | #345 | Tragic 96.2% |
| Immigrants | Yemen | 0.0 /100 | #346 | Tragic 95.9% |
| Spanish American Indians | 0.0 /100 | #347 | Tragic 95.8% |