Immigrants from Uzbekistan vs Okinawan Nursery School
COMPARE
Immigrants from Uzbekistan
Okinawan
Nursery School
Nursery School Comparison
Immigrants from Uzbekistan
Okinawans
97.4%
NURSERY SCHOOL
0.1/ 100
METRIC RATING
278th/ 347
METRIC RANK
98.2%
NURSERY SCHOOL
94.5/ 100
METRIC RATING
120th/ 347
METRIC RANK
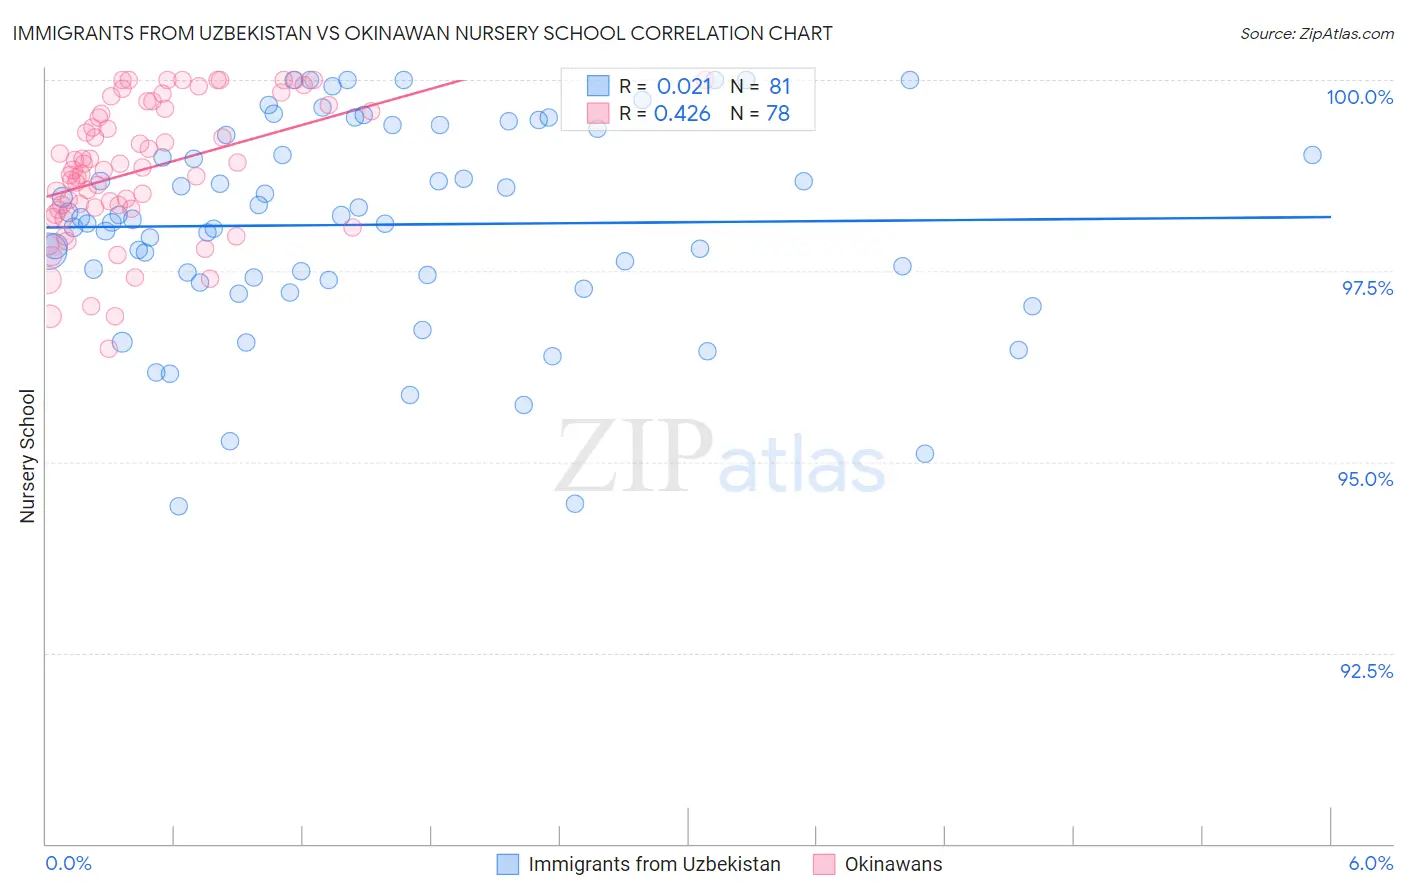
Immigrants from Uzbekistan vs Okinawan Nursery School Correlation Chart
The statistical analysis conducted on geographies consisting of 118,593,934 people shows no correlation between the proportion of Immigrants from Uzbekistan and percentage of population with at least nursery school education in the United States with a correlation coefficient (R) of 0.021 and weighted average of 97.4%. Similarly, the statistical analysis conducted on geographies consisting of 73,744,614 people shows a moderate positive correlation between the proportion of Okinawans and percentage of population with at least nursery school education in the United States with a correlation coefficient (R) of 0.426 and weighted average of 98.2%, a difference of 0.78%.
Nursery School Correlation Summary
| Measurement | Immigrants from Uzbekistan | Okinawan |
| Minimum | 94.4% | 96.5% |
| Maximum | 100.0% | 100.0% |
| Range | 5.6% | 3.5% |
| Mean | 98.1% | 98.8% |
| Median | 98.2% | 98.8% |
| Interquartile 25% (IQ1) | 97.4% | 98.3% |
| Interquartile 75% (IQ3) | 99.3% | 99.6% |
| Interquartile Range (IQR) | 1.9% | 1.3% |
| Standard Deviation (Sample) | 1.3% | 0.88% |
| Standard Deviation (Population) | 1.3% | 0.87% |
Similar Demographics by Nursery School
Demographics Similar to Immigrants from Uzbekistan by Nursery School
In terms of nursery school, the demographic groups most similar to Immigrants from Uzbekistan are Immigrants from Western Africa (97.4%, a difference of 0.010%), Immigrants from Ghana (97.4%, a difference of 0.010%), Barbadian (97.4%, a difference of 0.010%), Trinidadian and Tobagonian (97.4%, a difference of 0.010%), and Afghan (97.4%, a difference of 0.020%).
| Demographics | Rating | Rank | Nursery School |
| Immigrants | Peru | 0.2 /100 | #271 | Tragic 97.5% |
| Immigrants | Bolivia | 0.1 /100 | #272 | Tragic 97.5% |
| Immigrants | China | 0.1 /100 | #273 | Tragic 97.5% |
| Immigrants | Cameroon | 0.1 /100 | #274 | Tragic 97.5% |
| Ghanaians | 0.1 /100 | #275 | Tragic 97.5% |
| Immigrants | Philippines | 0.1 /100 | #276 | Tragic 97.5% |
| Immigrants | Western Africa | 0.1 /100 | #277 | Tragic 97.4% |
| Immigrants | Uzbekistan | 0.1 /100 | #278 | Tragic 97.4% |
| Immigrants | Ghana | 0.1 /100 | #279 | Tragic 97.4% |
| Barbadians | 0.0 /100 | #280 | Tragic 97.4% |
| Trinidadians and Tobagonians | 0.0 /100 | #281 | Tragic 97.4% |
| Afghans | 0.0 /100 | #282 | Tragic 97.4% |
| Immigrants | West Indies | 0.0 /100 | #283 | Tragic 97.4% |
| Immigrants | Trinidad and Tobago | 0.0 /100 | #284 | Tragic 97.4% |
| Immigrants | Barbados | 0.0 /100 | #285 | Tragic 97.4% |
Demographics Similar to Okinawans by Nursery School
In terms of nursery school, the demographic groups most similar to Okinawans are Immigrants from Zimbabwe (98.2%, a difference of 0.0%), Yugoslavian (98.2%, a difference of 0.010%), Thai (98.2%, a difference of 0.010%), Immigrants from Japan (98.2%, a difference of 0.010%), and Syrian (98.2%, a difference of 0.010%).
| Demographics | Rating | Rank | Nursery School |
| Immigrants | Latvia | 96.4 /100 | #113 | Exceptional 98.2% |
| Ute | 96.4 /100 | #114 | Exceptional 98.2% |
| Iranians | 96.3 /100 | #115 | Exceptional 98.2% |
| Spanish | 95.8 /100 | #116 | Exceptional 98.2% |
| Immigrants | France | 95.6 /100 | #117 | Exceptional 98.2% |
| Yugoslavians | 95.4 /100 | #118 | Exceptional 98.2% |
| Thais | 95.0 /100 | #119 | Exceptional 98.2% |
| Okinawans | 94.5 /100 | #120 | Exceptional 98.2% |
| Immigrants | Zimbabwe | 94.2 /100 | #121 | Exceptional 98.2% |
| Immigrants | Japan | 94.0 /100 | #122 | Exceptional 98.2% |
| Syrians | 93.9 /100 | #123 | Exceptional 98.2% |
| Lebanese | 93.8 /100 | #124 | Exceptional 98.2% |
| Iroquois | 93.7 /100 | #125 | Exceptional 98.2% |
| Menominee | 93.6 /100 | #126 | Exceptional 98.2% |
| Immigrants | Saudi Arabia | 93.4 /100 | #127 | Exceptional 98.2% |