Immigrants from Uzbekistan vs Cajun 11th Grade
COMPARE
Immigrants from Uzbekistan
Cajun
11th Grade
11th Grade Comparison
Immigrants from Uzbekistan
Cajuns
91.5%
11TH GRADE
1.0/ 100
METRIC RATING
248th/ 347
METRIC RANK
91.4%
11TH GRADE
0.7/ 100
METRIC RATING
257th/ 347
METRIC RANK
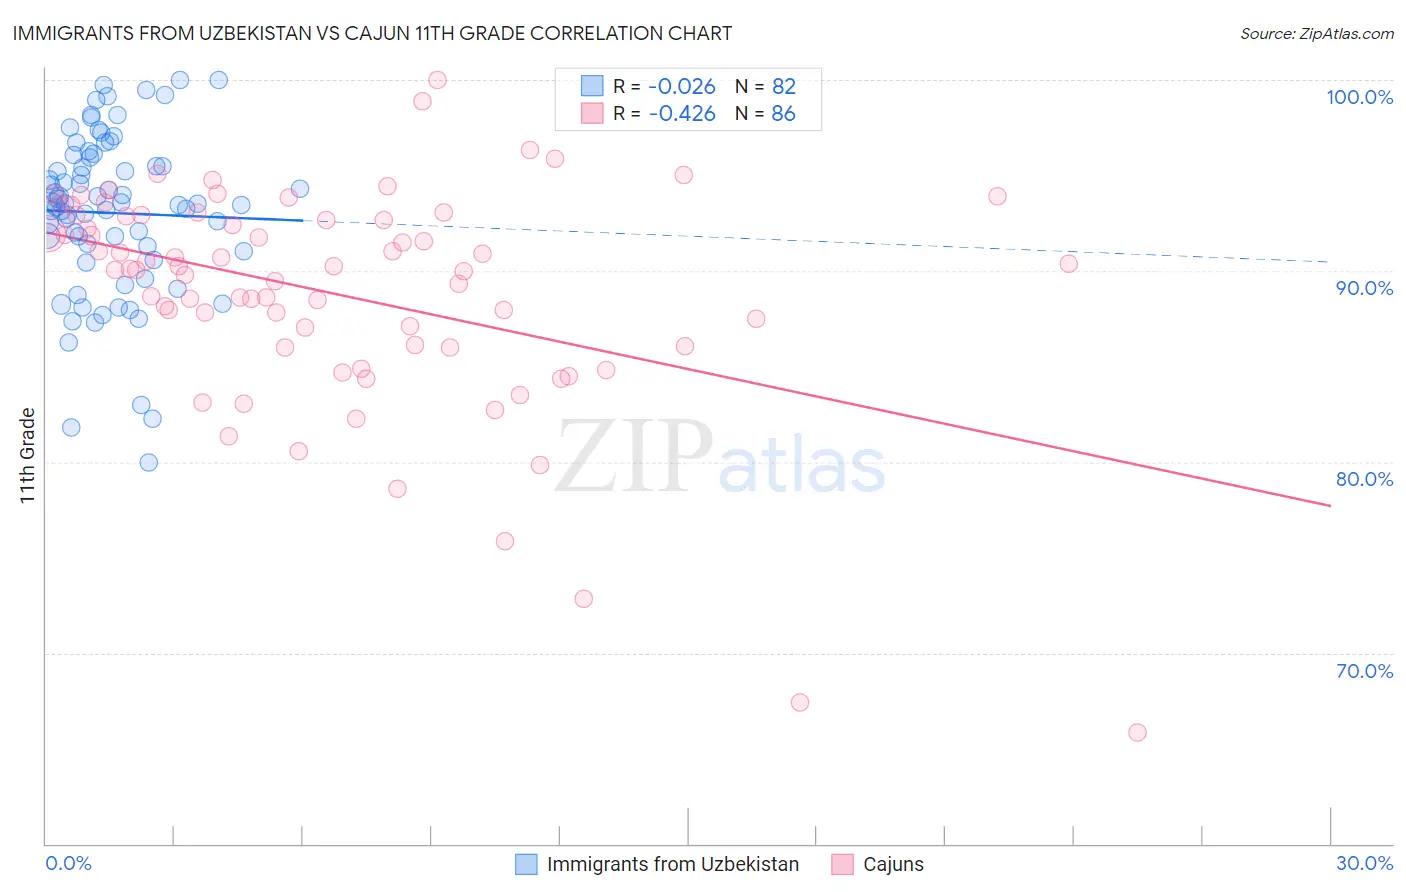
Immigrants from Uzbekistan vs Cajun 11th Grade Correlation Chart
The statistical analysis conducted on geographies consisting of 118,684,730 people shows no correlation between the proportion of Immigrants from Uzbekistan and percentage of population with at least 11th grade education in the United States with a correlation coefficient (R) of -0.026 and weighted average of 91.5%. Similarly, the statistical analysis conducted on geographies consisting of 149,713,149 people shows a moderate negative correlation between the proportion of Cajuns and percentage of population with at least 11th grade education in the United States with a correlation coefficient (R) of -0.426 and weighted average of 91.4%, a difference of 0.080%.
11th Grade Correlation Summary
| Measurement | Immigrants from Uzbekistan | Cajun |
| Minimum | 80.0% | 65.8% |
| Maximum | 100.0% | 100.0% |
| Range | 20.0% | 34.2% |
| Mean | 93.0% | 88.8% |
| Median | 93.5% | 90.1% |
| Interquartile 25% (IQ1) | 91.1% | 86.0% |
| Interquartile 75% (IQ3) | 95.9% | 92.9% |
| Interquartile Range (IQR) | 4.9% | 6.8% |
| Standard Deviation (Sample) | 4.3% | 5.9% |
| Standard Deviation (Population) | 4.2% | 5.9% |
Demographics Similar to Immigrants from Uzbekistan and Cajuns by 11th Grade
In terms of 11th grade, the demographic groups most similar to Immigrants from Uzbekistan are Immigrants from Philippines (91.5%, a difference of 0.0%), Peruvian (91.5%, a difference of 0.0%), Ghanaian (91.5%, a difference of 0.010%), Immigrants from Costa Rica (91.4%, a difference of 0.030%), and Seminole (91.5%, a difference of 0.040%). Similarly, the demographic groups most similar to Cajuns are Black/African American (91.4%, a difference of 0.010%), Immigrants from Senegal (91.4%, a difference of 0.010%), Immigrants from Eritrea (91.4%, a difference of 0.020%), Immigrants from Colombia (91.4%, a difference of 0.020%), and Jamaican (91.4%, a difference of 0.030%).
| Demographics | Rating | Rank | 11th Grade |
| Immigrants | Middle Africa | 1.6 /100 | #242 | Tragic 91.6% |
| Immigrants | Thailand | 1.4 /100 | #243 | Tragic 91.6% |
| Senegalese | 1.4 /100 | #244 | Tragic 91.6% |
| Africans | 1.3 /100 | #245 | Tragic 91.5% |
| Seminole | 1.2 /100 | #246 | Tragic 91.5% |
| Immigrants | Philippines | 1.0 /100 | #247 | Tragic 91.5% |
| Immigrants | Uzbekistan | 1.0 /100 | #248 | Tragic 91.5% |
| Peruvians | 1.0 /100 | #249 | Tragic 91.5% |
| Ghanaians | 0.9 /100 | #250 | Tragic 91.5% |
| Immigrants | Costa Rica | 0.9 /100 | #251 | Tragic 91.4% |
| Immigrants | Nigeria | 0.8 /100 | #252 | Tragic 91.4% |
| Immigrants | South America | 0.8 /100 | #253 | Tragic 91.4% |
| Immigrants | Eritrea | 0.7 /100 | #254 | Tragic 91.4% |
| Blacks/African Americans | 0.7 /100 | #255 | Tragic 91.4% |
| Immigrants | Senegal | 0.7 /100 | #256 | Tragic 91.4% |
| Cajuns | 0.7 /100 | #257 | Tragic 91.4% |
| Immigrants | Colombia | 0.6 /100 | #258 | Tragic 91.4% |
| Jamaicans | 0.6 /100 | #259 | Tragic 91.4% |
| Spanish Americans | 0.6 /100 | #260 | Tragic 91.4% |
| Taiwanese | 0.6 /100 | #261 | Tragic 91.3% |
| Immigrants | Uruguay | 0.5 /100 | #262 | Tragic 91.3% |