Immigrants from Uruguay vs Immigrants from North Macedonia 11th Grade
COMPARE
Immigrants from Uruguay
Immigrants from North Macedonia
11th Grade
11th Grade Comparison
Immigrants from Uruguay
Immigrants from North Macedonia
91.3%
11TH GRADE
0.5/ 100
METRIC RATING
262nd/ 347
METRIC RANK
93.5%
11TH GRADE
98.7/ 100
METRIC RATING
100th/ 347
METRIC RANK
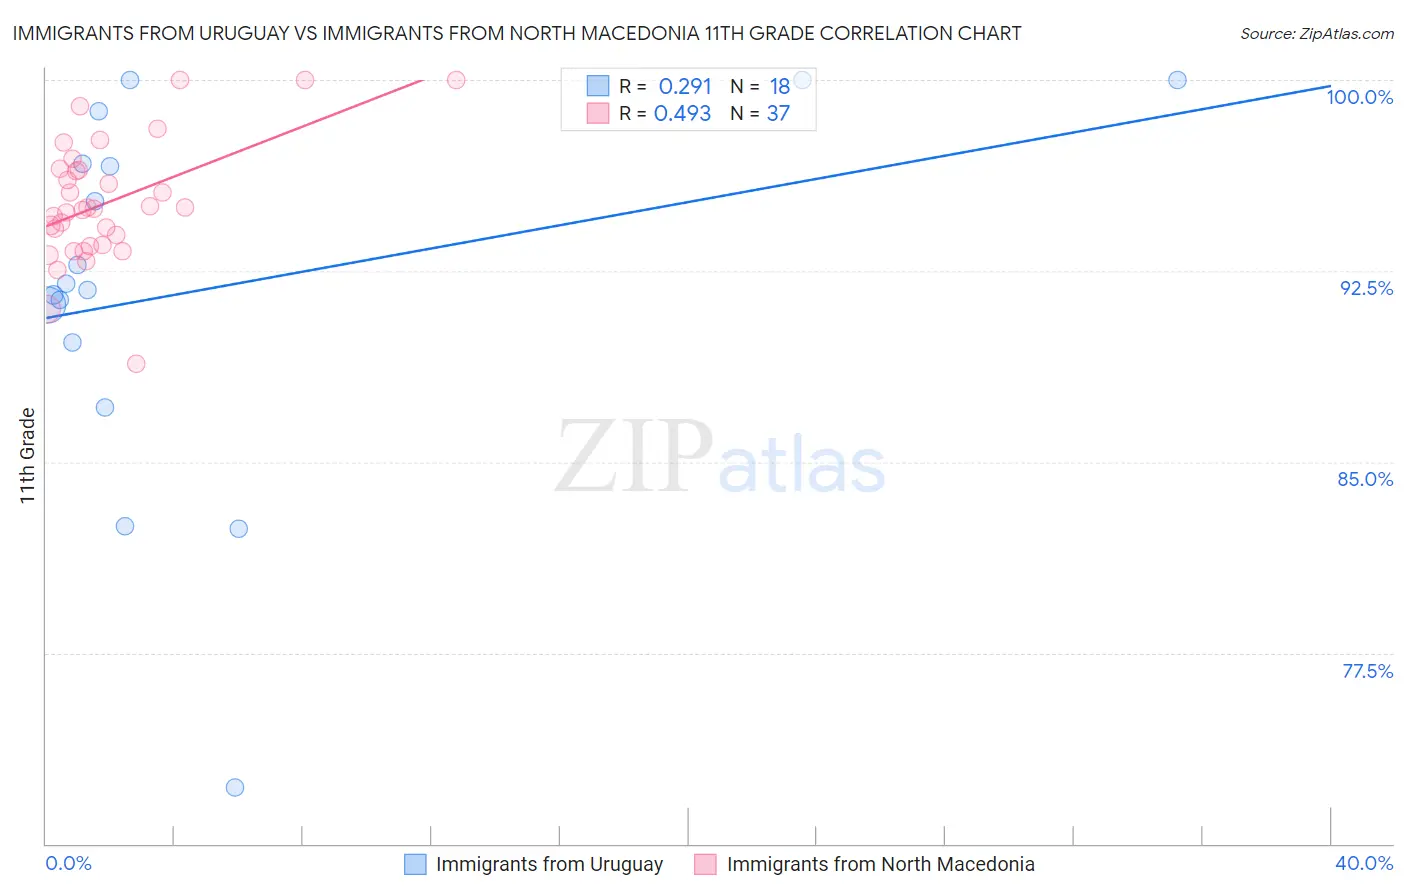
Immigrants from Uruguay vs Immigrants from North Macedonia 11th Grade Correlation Chart
The statistical analysis conducted on geographies consisting of 133,259,667 people shows a weak positive correlation between the proportion of Immigrants from Uruguay and percentage of population with at least 11th grade education in the United States with a correlation coefficient (R) of 0.291 and weighted average of 91.3%. Similarly, the statistical analysis conducted on geographies consisting of 74,300,344 people shows a moderate positive correlation between the proportion of Immigrants from North Macedonia and percentage of population with at least 11th grade education in the United States with a correlation coefficient (R) of 0.493 and weighted average of 93.5%, a difference of 2.4%.
11th Grade Correlation Summary
| Measurement | Immigrants from Uruguay | Immigrants from North Macedonia |
| Minimum | 72.2% | 88.9% |
| Maximum | 100.0% | 100.0% |
| Range | 27.8% | 11.1% |
| Mean | 91.8% | 95.2% |
| Median | 91.9% | 94.9% |
| Interquartile 25% (IQ1) | 89.7% | 93.5% |
| Interquartile 75% (IQ3) | 96.7% | 96.5% |
| Interquartile Range (IQR) | 7.0% | 3.0% |
| Standard Deviation (Sample) | 7.3% | 2.4% |
| Standard Deviation (Population) | 7.1% | 2.4% |
Similar Demographics by 11th Grade
Demographics Similar to Immigrants from Uruguay by 11th Grade
In terms of 11th grade, the demographic groups most similar to Immigrants from Uruguay are Taiwanese (91.3%, a difference of 0.010%), Spanish American (91.4%, a difference of 0.020%), Jamaican (91.4%, a difference of 0.030%), Immigrants from Colombia (91.4%, a difference of 0.040%), and Immigrants from Senegal (91.4%, a difference of 0.060%).
| Demographics | Rating | Rank | 11th Grade |
| Blacks/African Americans | 0.7 /100 | #255 | Tragic 91.4% |
| Immigrants | Senegal | 0.7 /100 | #256 | Tragic 91.4% |
| Cajuns | 0.7 /100 | #257 | Tragic 91.4% |
| Immigrants | Colombia | 0.6 /100 | #258 | Tragic 91.4% |
| Jamaicans | 0.6 /100 | #259 | Tragic 91.4% |
| Spanish Americans | 0.6 /100 | #260 | Tragic 91.4% |
| Taiwanese | 0.6 /100 | #261 | Tragic 91.3% |
| Immigrants | Uruguay | 0.5 /100 | #262 | Tragic 91.3% |
| Immigrants | Ghana | 0.3 /100 | #263 | Tragic 91.2% |
| Yup'ik | 0.3 /100 | #264 | Tragic 91.2% |
| Pueblo | 0.3 /100 | #265 | Tragic 91.2% |
| Immigrants | Western Africa | 0.3 /100 | #266 | Tragic 91.2% |
| Immigrants | Jamaica | 0.3 /100 | #267 | Tragic 91.2% |
| U.S. Virgin Islanders | 0.2 /100 | #268 | Tragic 91.1% |
| Ute | 0.2 /100 | #269 | Tragic 91.1% |
Demographics Similar to Immigrants from North Macedonia by 11th Grade
In terms of 11th grade, the demographic groups most similar to Immigrants from North Macedonia are Immigrants from Israel (93.5%, a difference of 0.010%), Menominee (93.5%, a difference of 0.010%), Immigrants from Romania (93.5%, a difference of 0.010%), Chippewa (93.5%, a difference of 0.020%), and Lebanese (93.5%, a difference of 0.020%).
| Demographics | Rating | Rank | 11th Grade |
| Puget Sound Salish | 99.1 /100 | #93 | Exceptional 93.6% |
| Swiss | 99.0 /100 | #94 | Exceptional 93.6% |
| Immigrants | France | 99.0 /100 | #95 | Exceptional 93.6% |
| Immigrants | Turkey | 98.9 /100 | #96 | Exceptional 93.5% |
| Immigrants | Iran | 98.9 /100 | #97 | Exceptional 93.5% |
| Immigrants | Israel | 98.8 /100 | #98 | Exceptional 93.5% |
| Menominee | 98.7 /100 | #99 | Exceptional 93.5% |
| Immigrants | North Macedonia | 98.7 /100 | #100 | Exceptional 93.5% |
| Immigrants | Romania | 98.7 /100 | #101 | Exceptional 93.5% |
| Chippewa | 98.6 /100 | #102 | Exceptional 93.5% |
| Lebanese | 98.6 /100 | #103 | Exceptional 93.5% |
| Immigrants | Europe | 98.6 /100 | #104 | Exceptional 93.5% |
| Immigrants | Serbia | 98.6 /100 | #105 | Exceptional 93.5% |
| Immigrants | Croatia | 98.6 /100 | #106 | Exceptional 93.5% |
| Immigrants | Norway | 98.4 /100 | #107 | Exceptional 93.5% |